

Logging & accounting
Every authentication, authorization and accounting (AAA) event that Taranac processes is recorded twice: as a structured, searchable record in the database (what you browse in the admin UI), and as a raw line in a forensic file log on disk. This page explains what each log type captures, how Taranac turns daemon output into records, where to view and export logs, how retention works, and how to walk through a real investigation.
The log views are read-only. You cannot edit or delete individual records from the UI — logs are immutable. They are removed only when their retention window expires.
- 1 write file log never suppressed
- 2 check exclusions per channel
- 3 re-evaluate policy matched rule
- 4 insert into database enriched
- 5 raise alerts · forward syslog if applicable
The five AAA log streams
Section titled “The five AAA log streams”Taranac keeps five separate log streams, three for TACACS+ and two for RADIUS. RADIUS has no separate authorization stream — under RADIUS, authorization happens inside the same Access-Request that authenticates the session.
| Stream | Protocol | What it captures |
|---|---|---|
| Authentication | TACACS+ | Login attempts: who tried to log in, from where, success or failure |
| Authorization | TACACS+ | Command / service authorization: each command a device sent for a permit/deny decision |
| Accounting | TACACS+ | Session and command accounting: starts, stops, watchdogs, elapsed time |
| Authentication | RADIUS | Access-Request outcomes: Accept / Reject, the credential transport, the reject reason, MFA result |
| Accounting | RADIUS | Session accounting: Start / Interim-Update / Stop, bytes transferred, framed IP |
In the admin UI these surface as three pages under Logging & Reports → AAA Logs: Authentication Log (TACACS+ and RADIUS on two tabs), Authorization Log (TACACS+ only), and Accounting Log (TACACS+ and RADIUS on two tabs).
Key concepts
Section titled “Key concepts”Enrichment snapshot. Every log record stores a snapshot of related display values at the moment it was written: device name, device groups, the network object the NAS belongs to (and its type — host / subnet / range), the user’s display name, and the user’s groups. Because these are snapshots, a log row keeps the device and user names it had at write time even if you later rename or delete those objects. The underlying device_id / user_id links are set to null on deletion, but the log survives.
Node (cluster attribution). Every log record also stores the cluster node that processed it (node_id, resolved to a display node_name). On a single-node install this is simply your one node; under high availability it tells you which node handled a given authentication — useful when tracing a failover or an uneven load. All five AAA log streams carry it, and it surfaces as a Node column and a “filter by node” control. On single-node deployments the node filter is hidden (there is only one node to pick), so the column is informative but the filter only appears once a cluster has more than one node.
Matched rule. Every authentication and authorization record shows which policy rule decided the outcome. TACACS+ records name it by rule_name (e.g. policy_1 or policy_default) plus the rule’s description as rule_label; RADIUS records carry the rule’s order number and the same label. Taranac determines the TACACS+ rule by re-evaluating the policy against the event, so the rule shown always reflects the policy as Taranac understands it. Accounting records do not carry a matched rule — accounting is not a policy decision.
All three of those streams also store the matched rule’s UUID alongside its name, shown in the detail panel as a stable identifier for correlation. It is deliberately stored without a foreign key: it is a forensic key and survives the rule being deleted, so a log row can still be tied to the rule that decided it long after that rule is gone.
Status. TACACS+ authentication is success / failure; authorization is permit / deny; RADIUS authentication is accept / reject. A RADIUS MFA round-trip does not produce a record of its own — one row is written at the final outcome, with the MFA result recorded beside it (mfa_enforced, mfa_status).
Credential transport (RADIUS). A RADIUS authentication record stores the transport the device actually used to present the password — PAP, MS-CHAPv2, MS-CHAP (v1, which Taranac refuses) or CHAP (likewise refused) — read from the attributes in the Access-Request itself. There is nothing to configure: the “authentication type” dropdown that used to sit in RADIUS settings was removed in 1.2.2, because nothing read it and the handler authenticated with PAP regardless. See Credential transports for what each path can and cannot do.
File log (forensic backup). In parallel with the database, every AAA event is also appended to a file on disk. The file log is a safety net: it is written first, before any exclusion or filtering is applied, so it captures events even for users you have deliberately excluded from database logging.
How a daemon event becomes a record
Section titled “How a daemon event becomes a record”Understanding the pipeline helps when a log looks wrong or a field is empty.
TACACS+
Section titled “TACACS+”The TACACS+ daemon (tac_plus-ng) streams every authentication, authorization and accounting event to Taranac’s parser. For each event the parser, in order:
- Writes the raw line to the file log (never suppressed).
- Checks the log-exclusion rules to decide whether to suppress this record in the database, in syslog forwarding, and/or in alerts — each channel independently.
- For authentication and authorization, re-evaluates the policy to fill in the matched rule and label.
- Inserts the enriched record into the database.
- Raises alerts where applicable (for example an auth failure, or an unknown device).
- Forwards to any configured syslog receivers.
A couple of field-mapping details worth knowing when reading TACACS+ logs:
- Line (the NAS port/line, e.g.
tty2) and Remote Address (the remote client IP) are both captured. Either can be empty depending on the device. Remote Address is a table column; Line is shown in the detail drawer and in exports. - TACACS+ accounting command data comes in two shapes. Command accounting stores the literal command (a trailing Cisco
<cr>marker is stripped). Exec/session accounting stores key/value pairs (task_id,service,priv-lvl, elapsed time, start/stop time, disconnect cause, etc.), which Taranac parses into structured fields. Anything it does not recognise is preserved under “Unknown Fields”.
Database inserts are batched rather than written one row at a time, and how a failed batch is handled depends on why it failed. A transient failure — the primary unreachable, or demoted mid-failover — re-queues the batch behind a short backoff, so the records land on the new primary instead of being lost; the buffer is capped so a long outage drops the oldest entries rather than growing without limit. A failure caused by the data itself (a value too long for its column, a malformed literal, a reference to a row that no longer exists) can never succeed on a retry, so that one batch is dropped once, loudly, with a sample of the offending raw line in the service log — and its records are still in the file log below. Before this rule existed a single bad batch could wedge the whole authentication-log writer: every event behind it queued forever, authentication kept working, and the operator watched a journal that had simply gone silent.
RADIUS
Section titled “RADIUS”The RADIUS handler (inside FreeRADIUS) runs the full policy evaluation in-process for every Access-Request — WHO, WHERE, source, and time-of-day matching, first match wins. It logs the authentication outcome (with the matched rule order, profile name, MFA status, whether the password came from cache, the credential transport read off the packet, the reject reason on a refusal, and the auth duration in milliseconds), and queues accounting records as they arrive.
A privilege escalation is logged as itself rather than as a login by a user who does not exist: the record carries an enable context and the privilege level the device asked for, which the log shows as an enable → 15 badge beside the synthetic $enab<N>$ name, with the request type and the requested level in the detail panel. The mechanism behind those requests is described under Privilege escalation (enable).
RADIUS records store the request attributes as structured data, with sensitive attributes (User-Password, CHAP-Password, MS-CHAP-*, EAP-Message) stripped before they are saved.
The RADIUS writer batches its inserts too, and it guards against the same hazard one step finer: a single row the database can never accept is dropped on its own — named in the service log by NAS, username and session — so the rest of the batch, and everything queued behind it, still lands.
Viewing logs in the admin UI
Section titled “Viewing logs in the admin UI”Open Logging & Reports → AAA Logs and pick Authentication Log, Authorization Log, or Accounting Log. Each page shows a paginated, sortable table with a consistent layout.
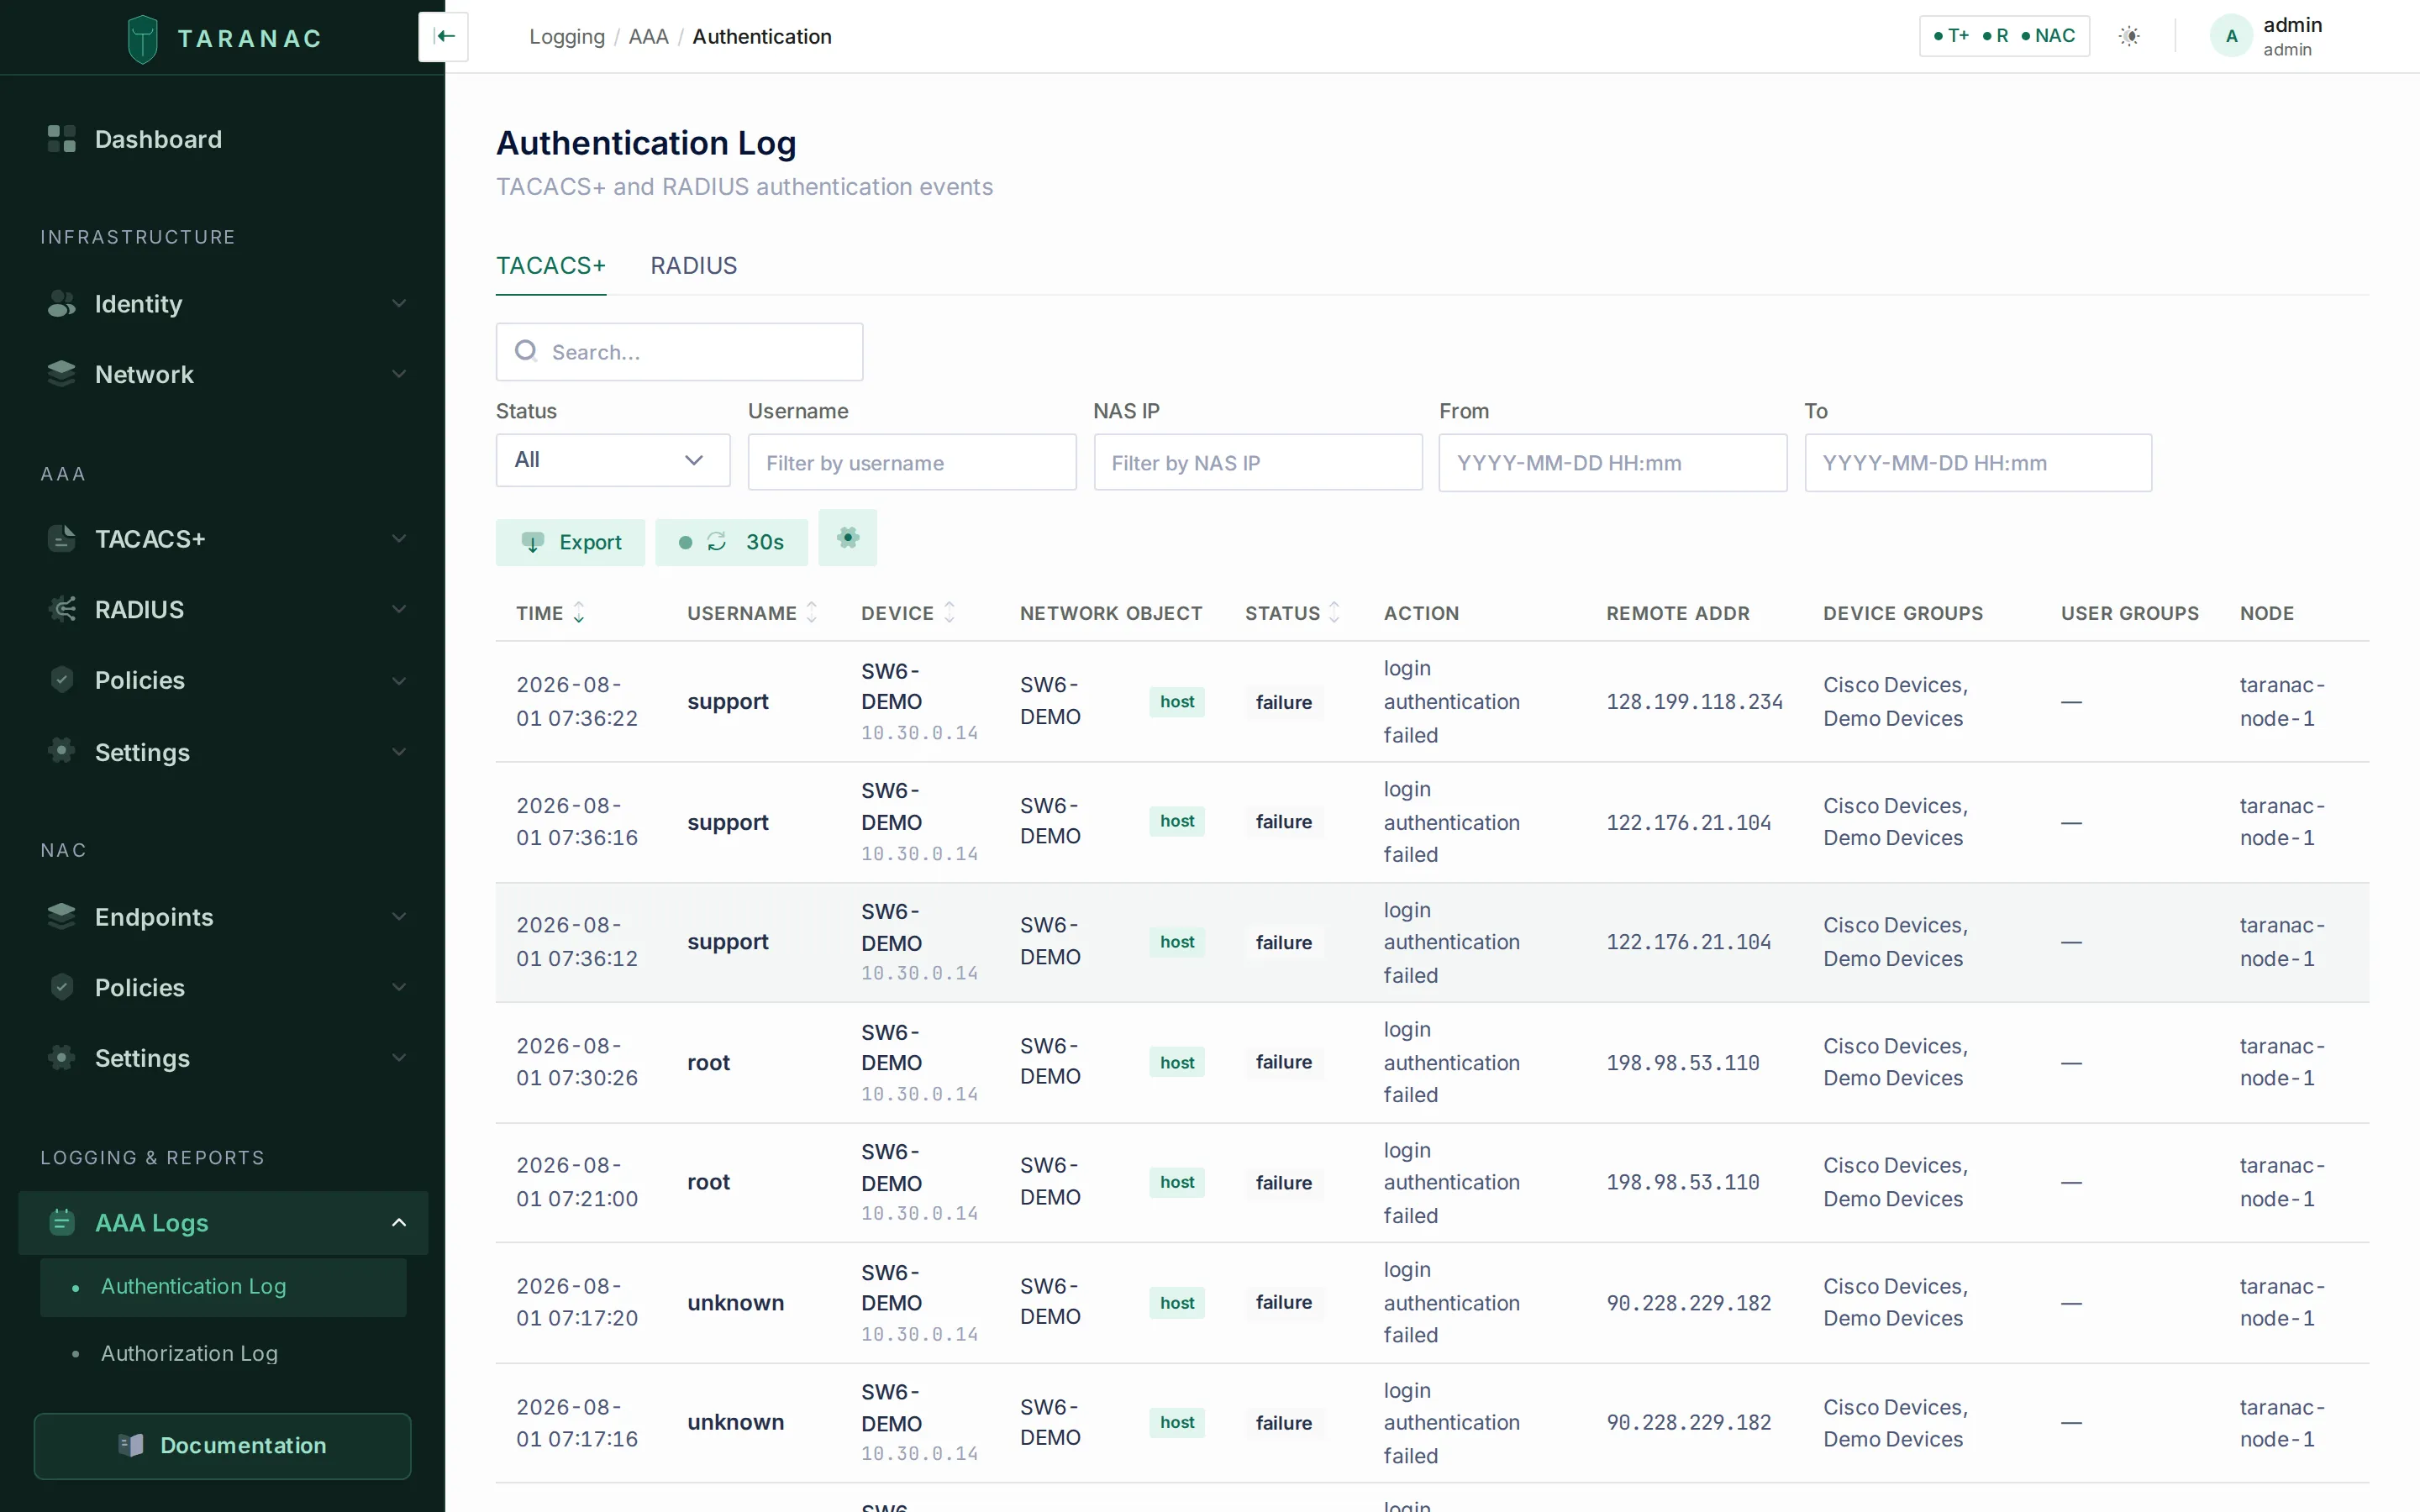 The Authentication Log: protocol tabs (TACACS+ / RADIUS), filters, column toggles, and a row-click detail drawer.
Each of the five tables starts from the same four identity columns — Time, Username, Device, Network Object — and ends with Device Groups, User Groups and Node. What differs is the middle:
| Table | Columns between identity and the group columns |
|---|---|
| Authentication → TACACS+ | Status · Action · Remote Addr |
| Authentication → RADIUS | Status · Auth Type · Calling Station · Reject Reason |
| Authorization (TACACS+) | Action · Command |
| Accounting → TACACS+ | Action · Service · Command · Task ID |
| Accounting → RADIUS | Status · Session ID · Duration · Terminate Cause |
Every column is visible out of the box and every one can be toggled off — nothing is hidden by default. Fields that are captured but not shown in the table (the TACACS+ line, server and unknown fields; the RADIUS service type, reply message, MFA state, auth duration and cache hit) live in the detail drawer.
Common UI behaviour across all log tables:
- Timestamps are shown in your system-configured timezone, not raw UTC.
- Username shows the login name in bold with the user’s display name beneath it; Device shows the device name (falling back to the NAS IP) with the IP in monospace below.
- Node shows the cluster node that processed the record (blank on installs that predate node attribution). The column is always available to toggle on; the matching node filter appears only on a multi-node cluster and only to an operator who may read the cluster roster (
cluster.view). - Auto-refresh can be set to Off, 10s, 15s, 30s, or 1m from the toolbar, and defaults to 30s. A green pulsing dot indicates it is active; refresh pauses automatically when the browser tab is hidden. On the tabbed pages only the tab you are looking at fetches — switching tabs does not leave a second poller running.
- Column widths can be dragged from the divider on the right of each header. Each table measures its own columns once real rows are on screen and then holds them, so narrowing one can pull an overflowing table back inside its container and take the horizontal scrollbar with it; the last column is elastic and always reaches the right edge. Double-click a divider to drop the layout and start over, or nudge a focused border with the arrow keys. Text a column is too narrow to show is clipped at the real column border and readable in full on hover. Widths are stored per table in your browser, in pixels, and a release that adds a column starts from a fresh measurement rather than restoring a layout built for a different column set.
- Column visibility is adjustable per table and remembered for the browser session (widths outlive it; visibility does not).
- A failed request says so. If the list request fails the table shows an error with a Retry button, never the “no records” empty state — an empty authentication log during an incident is the worst possible thing to read wrongly. If an auto-refresh fails over rows that are already on screen, the rows stay and a banner says they are the last data loaded successfully.
- Row click opens a read-only detail drawer with every captured field, plus the raw daemon line (TACACS+) or raw RADIUS request/attributes at the bottom.
Filtering and searching
Section titled “Filtering and searching”Each table offers a small set of column filters plus a free-text search. They behave differently, and choosing the right one matters:
| Control | Behaviour | Use it for |
|---|---|---|
| Username filter | Case-insensitive substring match | Finding an account without guessing the form the NAS sent it in — ad_user1, LAB\ad_user1 and ad_user1@lab.example.com all match ad_user1. % and _ are treated as literal characters, not wildcards |
| NAS IP filter | Exact match on the NAS address | Narrowing to one network device |
| Status filter | A dropdown, per stream: success/failure (TACACS+ authentication), accept/reject (RADIUS authentication), Start/Stop/Interim-Update (RADIUS accounting) | Isolating failures or rejects |
| Action filter | A typed value on the two TACACS+ streams that use it — permit/deny on Authorization, start/stop/watchdog on Accounting — matched exactly | Isolating denied commands, or session stops |
| Auth Type filter | RADIUS authentication only: PAP, MS-CHAPv2, CHAP, MS-CHAPv1 | Seeing where a credential transport is actually in use |
| From / To | Date and time pickers, entered in your system timezone and sent to the API as UTC. Each has an explicit Apply, so you can dial the time in before the table refetches | Bounding an investigation to a window |
| Node filter | Select a cluster node | Narrowing to one node on a high-availability cluster — only shown when more than one node exists |
| Search box | Partial match across username, NAS IP, device name, and user display name | You only remember part of a name, or want device-name matches |
Whenever a filter is set, a Clear filters button appears in the toolbar and the footer reports both totals: how many rows match the filters, and how many the table holds altogether.
Default sort is newest first (timestamp descending). The headers you can click to re-sort are Time, Username, Device (which sorts by NAS IP) and the stream’s Status or Action column. The API’s sort allow-list is wider than that — it also accepts device name, user display name, and per stream the matched rule, profile, service, credential transport or reject reason — so a sort the table does not offer is still reachable from the API.
Exporting
Section titled “Exporting”Each log page has an Export action that produces an XLSX (default) or CSV file. Choose the scope:
- Current view — exports exactly what you are looking at: the current page, with all active filters, search, and sort applied. The drawer shows the active filters as badges so there is no doubt what is being exported.
- All entries — exports the complete log, capped at 10,000 rows. Only the sort carries over: pagination, filters and the search box are deliberately not applied, so this is the whole table and not a wider slice of your current view. Narrow first with “Current view” if that is what you want.
Exports include all the enrichment snapshot columns, so an exported row is self-contained even months later. They also carry fields the table does not show — the TACACS+ line, rule name and rule label, the RADIUS reject reason and MFA state — and the record and device/user IDs.
Viewing logs requires the aaa_logs_view permission — see Roles & permissions. Export is currently gated by the same view permission rather than by a separate export right.
Common scenarios
Section titled “Common scenarios”Investigate a failed device login (TACACS+)
Section titled “Investigate a failed device login (TACACS+)”A network engineer reports they cannot log in to a switch.
- Open Authentication Log → TACACS+ tab.
- Set the Status filter to
failureand put the engineer’s account in the Username filter (or type a fragment into Search). - Click the failing row. The detail drawer shows the NAS IP and device name, the line and remote address, the action message from the device, and crucially the matched rule — for example
policy_default: Default catch-all, which tells you no specific rule matched and the request fell through to the default. - If the device name is blank and only a NAS IP shows, the NAS is not registered in Network devices — that is usually the real problem.
Trace what a user actually did on a device (TACACS+)
Section titled “Trace what a user actually did on a device (TACACS+)”- Open Authorization Log, filter by Username and NAS IP.
- The Command column shows each command the device sent for a permit/deny decision; the Action column shows whether it was permitted or denied.
- For session timing and disconnect reasons, switch to Accounting Log → TACACS+ and look at the elapsed time, start/stop times, and disconnect cause in the detail drawer.
Diagnose a RADIUS reject
Section titled “Diagnose a RADIUS reject”- Open Authentication Log → RADIUS tab, set Status to
Reject. - The Reject Reason column tells you the stage and cause. It is written by the service as a short token and rendered in your own language — the vocabulary is 36 translated reasons in every bundled language. A reason from a service newer than the interface falls through to the raw token rather than leaving the cell blank, so an unfamiliar-looking value is a version skew, not a bug.
Reading them by stage:
| Stage | Reasons you will see |
|---|---|
| The account | user_not_found, inactive (disabled), locked, not_yet_valid, expired, password_expired, must_change_password |
| The password | bad_password; empty_password_probe (see below) |
| The policy | no_policy_match (nothing matched — implicit reject), policy_deny (a rule refuses explicitly) |
| MFA | mfa_failed, mfa_not_configured (required but the user has enrolled nothing), mfa_provider_unsupported (the rule requires MFA but the user’s provider cannot push, and MS-CHAPv2 has nowhere to put an OTP) |
| The transport | chap_unsupported, mschapv1_unsupported, mschap_malformed |
| The NT hash behind MS-CHAPv2 | mschap_no_nt_hash (local account whose password predates NT hashes), mschap_bad_nt_hash, mschap_domain_not_joined, mschap_live_read_failed, mschap_dictionary_missing |
| The directory / domain | domain_unreachable, domain_auth_unavailable, domain_access_denied, domain_trust_broken, domain_time_skew, domain_not_configured, ntlm_blocked |
| The account’s Windows restrictions | account_restriction, logon_hours_denied, workstation_denied, smartcard_required |
| Privilege escalation | enable_not_configured (no global enable password is set), enable_bad_password |
The transport and NT-hash reasons are explained in Credential transports; the two enable reasons in Privilege escalation (enable).
- Open the row to see the credential transport, the service type, MFA status, whether the result came from the auth cache, the matched rule and its UUID, and the raw (sanitised) RADIUS request.
Confirm a session and its data usage (RADIUS)
Section titled “Confirm a session and its data usage (RADIUS)”Open Accounting Log → RADIUS. The Status column shows Start / Interim-Update / Stop; the detail drawer shows session duration, input/output bytes, framed IP, calling/called station, and terminate cause. A session with a Start but no Stop is still open (or the Stop was lost).
When to use which log
Section titled “When to use which log”| Question you’re asking | Go to |
|---|---|
| Did this admin successfully log in to a device? | Authentication Log → TACACS+ |
| What commands did this admin run, and were they allowed? | Authorization Log |
| How long was this device session, and how did it end? | Accounting Log → TACACS+ |
| Was this network user/host granted or denied access? | Authentication Log → RADIUS |
| How much data did this session move, and from what framed IP? | Accounting Log → RADIUS |
| Did MFA fail, and at which step? | Authentication Log → RADIUS (reject reason mfa_failed / mfa_not_configured / mfa_provider_unsupported) |
| Which credential transport did this device actually use? | Authentication Log → RADIUS, Auth Type column or filter |
| Which interface, or which VLAN, did an endpoint land on? | NAC authentication and NAC sessions — the AAA logs record neither |
| An event is missing from the UI logs | Check log exclusions, then the on-disk file log |
File log on disk (forensic backup)
Section titled “File log on disk (forensic backup)”The file log is independent of the database and of exclusion rules. It is the authoritative forensic record.
Each daemon writes into its own log volume, so the protocol separation is the volume rather than a directory level. Inside a volume the archive is organised by log type and month, one file per day:
{daemon log volume}/{log_type}/{YYYYMM}/{YYYY-MM-DD}.logInside the TACACS+ or RADIUS container that volume is mounted at /var/log/taranac, so a TACACS+ authorization record for 24 June 2026 lands in /var/log/taranac/authorization/202606/2026-06-24.log. The backend mounts all of them side by side — /app/logs/tacacs, /app/logs/radius (and /app/logs/nac for the NAC daemon) — which is how one screen can show all three archives at once. All the paths are environment-overridable, and file logging is on by default.
- TACACS+ files contain the raw lines from the daemon, one record per line, saved as-is.
- RADIUS files are JSON-lines — one JSON object per line:
{"timestamp":"2026-06-24T12:34:56+00:00","username":"admin","nas_ip":"10.0.0.1","status":"accept","reason":null,"auth_type":"PAP","device_name":"sw-core-01","rule_label":"Network admins","profile_name":"Cisco IOS priv 15","calling_station_id":null,"auth_duration_ms":18,"mfa_enforced":false,"mfa_status":null,"auth_context":"login","requested_priv_level":null}The file archive is rotated on the same retention window as the database, by the same nightly job (see below): whole YYYYMM directories are removed once the entire month has aged past the retention days for that protocol. The current month is never touched — the daemon is writing into it. Because these files are local to the node that wrote them, each node in a cluster prunes its own archive.
You can also inspect and prune the archive by hand from Settings → System → Log Rotation: it lists each daemon’s months with the file count, the size, and the date auto-cleanup will become eligible; expanding a month lists its files for download; and a past month can be deleted outright, even inside the retention window. The current month is refused.
Retention & rotation
Section titled “Retention & rotation”Database logs are pruned automatically by retention windows you control under Settings → System → Log Rotation. Editing a retention value goes through the standard settings API and requires the settings.edit permission.
| Setting | Default (days) | Applies to |
|---|---|---|
tacacs.log_retention_days | 365 | The three TACACS+ logs and their file archive |
radius.log_retention_days | 365 | The two RADIUS logs and their file archive |
How pruning works: each of the five tables is range-partitioned by month in PostgreSQL. A daily maintenance job pre-creates upcoming monthly partitions, and a daily cleanup job drops whole monthly partitions once the entire month has aged past the retention window. Because expired data is removed by dropping a partition rather than deleting rows, cleanup is effectively instant and does not bloat the database. The same cleanup run then applies the same test to the on-disk file archive, so files and partitions age out in lock step. Partial (still-current) months are never dropped, and setting a retention value of 0 or less disables deletion entirely.
The same Log Rotation screen shows, per table, how it is partitioned, the oldest and newest months held, how far ahead partitions are pre-created, which month the next cleanup will drop, and how much disk each one occupies. It also offers buttons to run the partition and cleanup jobs on demand.
Related
Section titled “Related”- AAA policies — how the rules that decide permit/deny (and which log exclusions suppress records) are configured.
- Network devices — registering NAS devices so logs show device names instead of bare IPs.
- RBAC — the
aaa_logs_viewpermission that gates these views and exports. - Audit & syslog — forwarding these events to a SIEM, and the administrative audit trail.
- High availability — clustering, and the Node column that records which cluster node processed each row.
- NAC authentication — endpoint (802.1X / MAB) authentication logging.
- Get Taranac on GitHub