

Alerts
Taranac watches itself and the boxes it runs on, and turns “something is wrong” into a small, stable list of alerts you can work through. An alert is a condition — disk filling up, RADIUS unreachable, an identity being brute-forced — not a stream of events. It opens (fires) when the condition appears and resolves when it clears, so a problem that lasts ten minutes is one row, not six hundred log lines.
This page covers where alerts come from, how severity is assigned, how operators acknowledge and clear them in the admin UI, and how to tune email notifications so you hear about the things that matter without being buried.
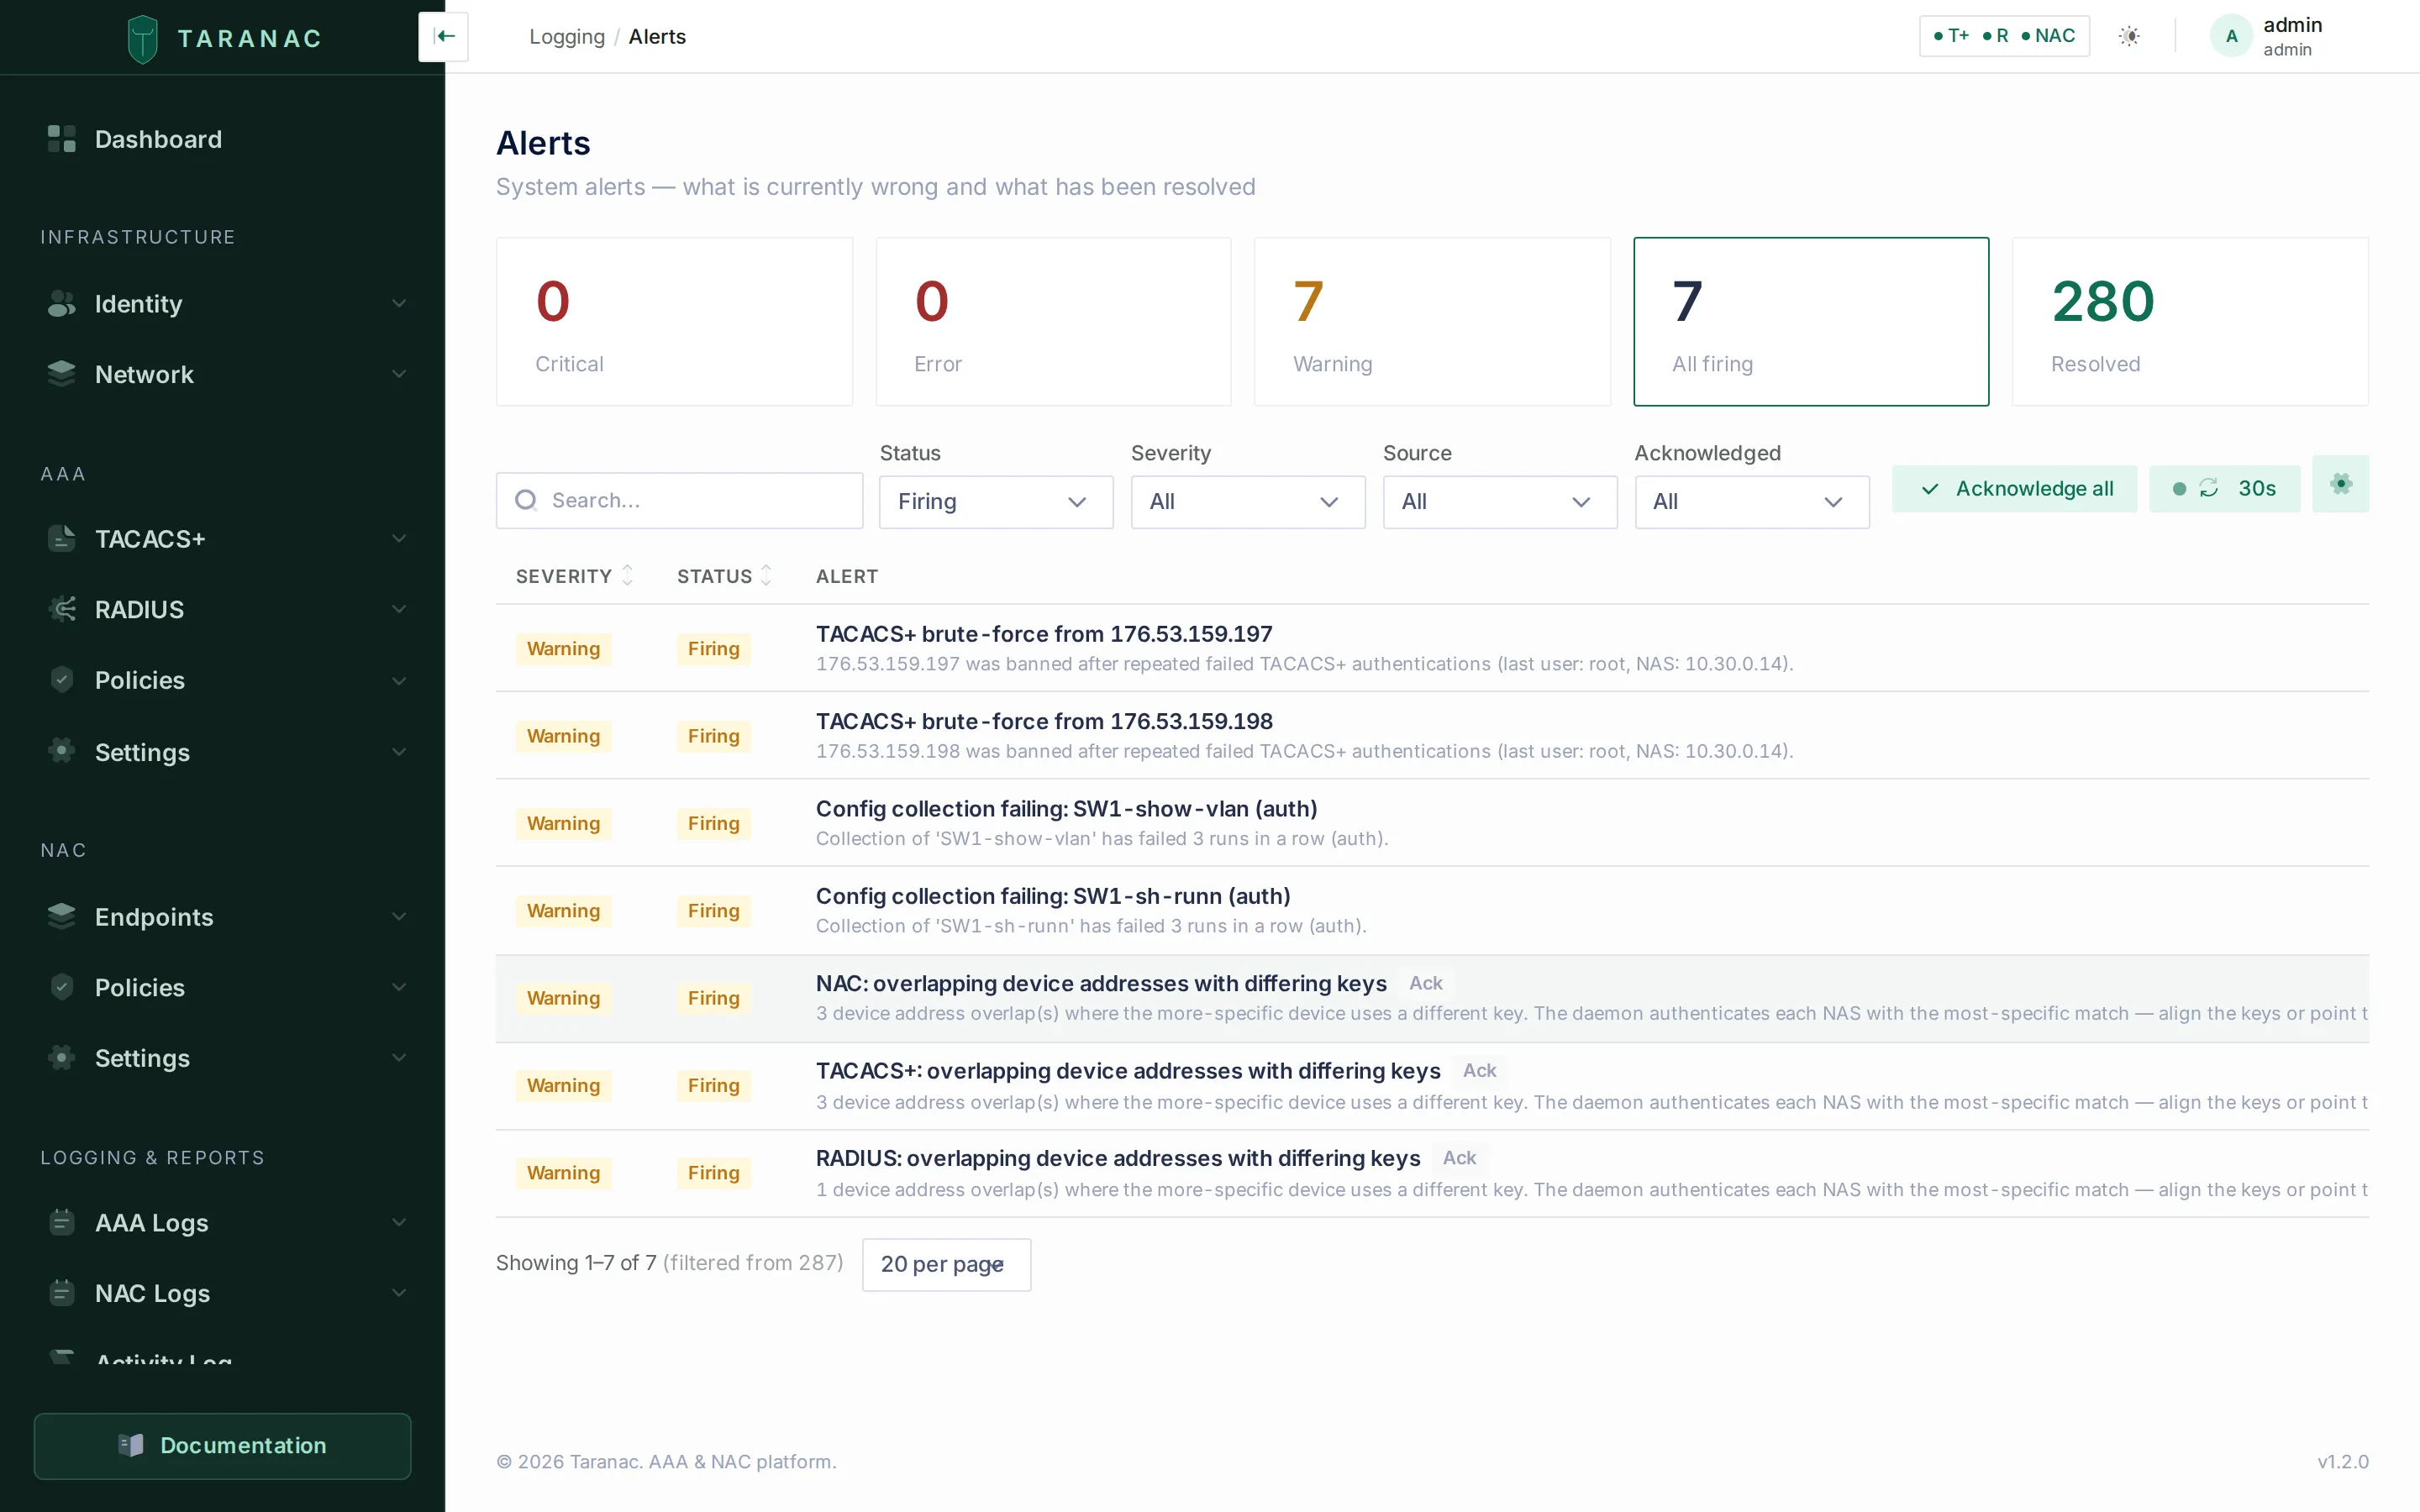 The Alerts page: severity-sorted firing conditions with acknowledge and resolve actions. This is a standalone install; on a cluster a Node column and a node filter join the toolbar.
- firing · disk > 80% warning
- recurs · same fingerprint count++
- acknowledged · still firing repeats off
- escalates · disk > 90% critical · ack cleared
- resolved · auto, on recovery all clear
Key concepts
Section titled “Key concepts”Alert — a single condition with a lifecycle. It carries a severity, a title and message, the originating source, an occurrence count, and timestamps for first-seen, last-seen and (once cleared) resolved.
Status — firing / resolved. This is the machine-driven axis. The system opens an alert when it detects the condition and resolves it automatically when the condition goes away. You normally do not set this by hand.
Acknowledged. This is the operator axis, completely separate from status. Acknowledging an alert means “I have seen this and I am on it.” It does not close the alert — the condition is still firing — but it silences repeat notifications so you stop getting reminded about something you are already handling.
Source. The subsystem that raised the alert. The producers that exist today are monitoring (host resources and daemon health), tacacs / radius / nac (AAA anomalies bridged from the protocol daemons), the three config builders (tacacs_config, radius_config, nac_config — validation failures plus inheritance advisories), email (the alert engine’s own delivery self-check), mfa (provider reachability), domain (the MS-CHAPv2 machine-account trust), backup, license, the Configuration Tracker’s three (ncm_collection, ncm_collector, ncm_drift), and — only when running clustered — cluster_license (node count or edition against the licence) and cluster_sync (HA health). Every one of them is enumerated under Alert sources below.
Fingerprint. A stable internal identity for the condition (for example disk:/var or nac:brute_force:peap:jdoe). It is what keeps a recurring problem collapsed into one alert: while a condition keeps recurring, Taranac bumps the existing alert’s occurrence count rather than opening duplicates. Once an alert resolves, a fresh occurrence later opens a new one — so you get clean history, not endless churn.
Node. On an HA cluster every alert also records the node that observed and opened it, stamped once on open and kept stable across recurrences. For per-node conditions the fingerprint is additionally scoped to that node (an @<node> suffix), so a healthy peer can never resolve another node’s firing alert — each node keeps its own row. Everything a node observes about itself is scoped that way: host resources, daemon reachability and the daemon-not-authenticating checks, config validation, MFA provider reachability, the domain machine-account trust, both backup alerts, and the config-apply readiness gate. Conditions that are a function of replicated data, or that only the leader can observe, stay a single alert per cluster, stable across failover: the licence checks, the cluster_sync reconciles, the email self-check, the Configuration Tracker alerts, and the key/banner inheritance advisories. On a standalone install there is one node and the scoping is inert — the fingerprint is left untouched.
Severity scale
Section titled “Severity scale”Severity is assigned by the producer, not by the operator. The four levels follow a deliberate rubric:
| Severity | Meaning | Examples |
|---|---|---|
info | Nothing broken, informational only. The level exists and can be filtered on, but no producer uses it today. | — |
warning | Not broken yet — a deadline or trend approaching. | Disk at 80%; brute-force detected; unknown device seen. |
error | Something has failed, but core AAA still works. | Config validation failed; email delivery failing; a scheduled backup failed; an MFA provider degraded. |
critical | Active authentication outage or security condition. | RADIUS / TACACS+ unreachable, or up and refusing every request. |
Two boundary rules make this easy to reason about:
warningvserror— “about to happen” versus “already happened.”errorvscritical— is authentication itself impacted, or just a peripheral function?
If a condition gets worse while already firing (for example disk crosses from warning into critical), the alert escalates: its severity is raised, any acknowledgement is cleared, and it becomes eligible to notify again — so an escalation always gets your attention even if you had silenced the milder version.
Alert sources
Section titled “Alert sources”Everything below is the complete catalogue: every condition the product can raise today, with its fingerprint, severity and scope. Unless a row says otherwise, an alert auto-resolves on the next healthy observation of the same condition — you never have to close it by hand.
Host resources and service health (monitoring)
Section titled “Host resources and service health (monitoring)”The evaluator reads live host metrics every cycle and compares them against configurable percentage thresholds. All of these are per node — they are read from this machine’s psutil:
| Condition | Fingerprint | Default warning | Default critical |
|---|---|---|---|
| Disk usage (per mount) | disk:<mount> | 80% | 90% |
| CPU usage | cpu:load | 90% | disabled |
| Memory usage | memory:usage | 85% | 95% |
| Swap usage | swap:usage | disabled | disabled |
A threshold breach must persist for alerts.sustained_minutes (default 2) before the alert opens — this debounce stops a momentary CPU spike from paging you. Recovery clears the alert immediately, no debounce. Setting a level’s threshold to 0 disables it.
Daemon health is checked with no debounce — an AAA outage should surface at once. Two different questions are asked, and the second exists because the first is not enough:
| Condition | Fingerprint | Severity | Opens |
|---|---|---|---|
| TACACS+ health check fails | service:tacacs | critical | immediately |
| RADIUS health check fails | service:radius | critical | immediately |
| TACACS+ is up but not authenticating | service:tacacs_backend | critical | after a 30 s stall |
| RADIUS is up but not authenticating | service:radius_backend | critical | after a 30 s stall |
| NAC is up but not authenticating | service:nac_backend | critical | after a 30 s stall |
All five are node-scoped: the node that lost its database is the one that is degraded, and a healthy peer must not clear its alert.
The service:*_backend trio (1.2.8) states the condition the port check misses. Under load on the stand, TACACS+ refused 163 of 180 logins while the container stayed healthy, port 49 answered and cluster status printed Healthy — a daemon that has lost its database says a cheerful yes to “is your port open?” and refuses every authentication it receives. These alerts are reported by the daemon itself, not inferred.
The 30 seconds is a grace, not a debounce. A daemon that has just come up refuses while its workers load their caches — 7 to 20 seconds on a loaded node — so a routine docker compose up -d used to land a critical alert and an email that resolved a minute later. A real outage lasts until the database comes back, so it clears the grace on its first evaluation and alerts at once, exactly as service:tacacs / service:radius do.
There is no service:nac port check — the NAC daemon’s liveness is covered by service:nac_backend alone.
Configuration validation and inheritance advisories
Section titled “Configuration validation and inheritance advisories”When you change AAA configuration, the config jobs re-render and validate it against the daemon’s own binary. They also re-run the device-key and banner inheritance analysis while they are there, and surface anything ambiguous as an advisory:
| Fingerprint | Severity | Scope | Condition |
|---|---|---|---|
tacacs_config:validation, radius_config:validation, nac_config:validation | error | per node | The rendered config failed the daemon’s validator. A subsequent successful reload resolves it — from either the background auto-reload or a manual reload. |
<source>:key_overlap (all three) | warning | cluster-wide | Device addresses overlap and the more-specific device uses a different key. |
<source>:group_inheritance (all three) | warning | cluster-wide | A device with no key of its own inherits from the oldest of several groups whose keys disagree. |
tacacs_config:banner_inheritance | warning | cluster-wide | The same case for a login banner — raised when a device has no own value and two or more of its groups disagree. Each affected device/banner-field pair is listed in the alert’s details; the welcome banner and the MOTD inherit independently, so they are counted separately. TACACS+ only. |
Validation is node-scoped because it runs this node’s binary against this node’s rendered files — a local render fault, or a lagging replica’s data, can fail on one node while a peer’s succeeds. The three advisories are a deterministic function of the replicated configuration, identical everywhere, so they stay cluster-wide.
The banner advisory has its own fingerprint deliberately: a banner ambiguity and a key ambiguity are different faults with different fixes, and sharing one fingerprint would let whichever synced last clear the other’s alert.
Email delivery self-check (email)
Section titled “Email delivery self-check (email)”Email is the alert engine’s own notification channel, which makes a broken SMTP a blind spot — alert mail would silently never arrive. Taranac watches its own outgoing-mail audit trail (EMAIL_SENT / EMAIL_FAILED) and opens an error alert (email:delivery) after alerts.email_failure_threshold failures since the last success (default 3). It resolves on the next successful send, or once the failures age out of a 24-hour lookback window. Set the threshold to 0 to turn the self-check off.
The audit trail is replicated, so this reads identically on every node. It is therefore reconciled on the leader only and stays cluster-wide — node-scoping would report one broken mail server once per node.
AAA and NAC anomaly alerting (tacacs, radius, nac)
Section titled “AAA and NAC anomaly alerting (tacacs, radius, nac)”The protocol daemons cannot call the alert service directly, so they write to a bridge table that the evaluator drains each cycle and promotes into stateful alerts. Each protocol’s condition is tracked independently:
| Fingerprint | Severity | Condition |
|---|---|---|
tacacs:brute_force:<subject>, radius:brute_force:<subject> | warning | A source the daemon’s own ban guard banned after repeated failed authentications. The subject is the client address (RADIUS uses a prefixed key — csi:<calling-station> or nas:<ip>). |
nac:brute_force:<method>:<identity> | warning | Repeated failed credential authentications for one identity over 802.1X, keyed by the inner username being guessed — e.g. nac:brute_force:peap:jdoe. |
<protocol>:unknown_device:<nas_ip> (all three) | warning | A request reached the daemon from a NAS that is not in the device inventory — only possible when a broad-admit setting let it in (global key, dynamic-client network). |
NAC brute-force detection counts once per authentication attempt — an EAP attempt is many packets, and Taranac counts the logical outcome, not each round-trip. Defaults: enabled, threshold 10 failures, window 15 minutes (nac.bruteforce_*). The unknown-device alert is throttled at the daemon: at most one bridge row per NAS IP per 10 minutes, so a chatty unknown switch cannot flood the queue.
These are event-type alerts: the daemons have no way to report “the condition stopped”, so they auto-resolve after alerts.event_ttl_minutes (default 60) with no fresh occurrence, rather than on an all-clear signal.
MFA provider health (mfa)
Section titled “MFA provider health (mfa)”A degraded MFA provider silently breaks login for everyone enrolled in it, so a watchdog polls each enabled provider’s health every 90 seconds and reconciles an mfa:<provider> alert (error) from the result. A disabled provider never alerts, and each check has a 10-second ceiling so one slow provider cannot stall the others.
The alert is node-scoped, because reachability is: one node may reach the push service or the SMS gateway while its peer cannot, and a healthy peer must not clear the node that is broken. See Multi-factor authentication.
Domain trust (domain)
Section titled “Domain trust (domain)”One error alert, domain:membership, node-scoped — each node holds its own machine account. The condition is deliberately narrow: MS-CHAPv2 is switched on, and this node can no longer verify a domain password. It covers two causes, distinguished in the message and the details:
- the
taranac-winbindsidecar is not reporting its status at all, so domain accounts cannot be authenticated here; - the node holds a machine account but the domain controller no longer accepts it — a stale machine password (restored from a backup, or a second node joined under the same name) or a computer object deleted in AD.
A member with MS-CHAPv2 deliberately switched off never pages anyone, and “never joined” is not an alert — that is a state the MS-CHAPv2 tab shows plainly, and it is the state every installation starts in. The bad state must persist for 5 minutes before the alert opens, so a controller reboot does not page anyone; recovery is not delayed and clears it on the first healthy observation.
Backups (backup)
Section titled “Backups (backup)”| Fingerprint | Severity | Condition |
|---|---|---|
backup:scheduled | error | The scheduled backup run failed. Cleared by the next successful run. |
backup:incomplete | error | The archive was created but does not hold everything it declares — a component that did not materialise, or a file that exists and could not be read. |
Both are node-scoped as of 1.2.8. The scheduled backup is a leader-only job, but what fails is node-local: this node ran out of space, lost a mount, or cannot read its own config/etcd-ca. A shared identity let a failover launder the fault — a node with a full disk had its alert cleared by a successful backup on the node that took leadership, while nothing about it had changed.
The stated cost of that: a node that raised the alert and then stopped being leader keeps a firing row nothing clears automatically, because it never runs the job again to report success. Close that row by hand, once. A cluster upgraded from 1.2.7 or earlier also carries one old unscoped row to close once. See Backups & upgrades.
Configuration Tracker (ncm_collection, ncm_collector, ncm_drift)
Section titled “Configuration Tracker (ncm_collection, ncm_collector, ncm_drift)”All cluster-wide, all reconciled on the leader:
| Fingerprint | Severity | Condition |
|---|---|---|
ncm_collection_failed:<config-id> | warning | The last 3 scheduled collections of one tracked config all failed (ncm.retry.escalate_after). Cleared by the next good collection. |
ncm_collection:sweep_behind | warning | The embedded collector cannot finish a full sweep within the configured interval, so ticks are being deferred — the cue to move to a standalone collector or lengthen the interval. |
ncm_collector_offline:<collector-id> | warning | A standalone collector’s last heartbeat is older than 15 minutes. One alert per collector, not per config — the blast radius is rolled up as an affected-config count in the details. Scanned every 5 minutes. |
ncm_drift:<config-id> | warning | A collected config diverged from its baseline, detected at ingest. Gated on ncm.drift_system_alert_enabled (default on); turning that off resolves whatever was already firing. |
A collector that has never heartbeated reads unknown, not offline, and never alerts; an embedded collector is the leader and never alerts either.
A collector whose snapshot contract does not match its core is refused before the poll counts as a heartbeat, so it goes quiet and surfaces here as ncm_collector_offline — the alert names a silent collector, not the version skew underneath it. Since 1.2.7 the core reports its own version even on that refusal, so ./collector-join.sh --update moves the collector to the version its core runs instead of insisting it is already in step.
Cluster / HA and licensing (license, cluster_license, cluster_sync)
Section titled “Cluster / HA and licensing (license, cluster_license, cluster_sync)”license:validation (error, cluster-wide) fires on any install — not just clustered ones — when a stored Pro licence cannot be honoured: a signature that does not verify, or one issued for a different installation. It only surfaces the problem; it disables nothing.
The rest exist only on an HA deployment. cluster_license carries one fingerprint; cluster_sync is a family sharing one source:
| Fingerprint | Severity | Scope | Condition |
|---|---|---|---|
cluster:max_nodes | error | cluster | Active nodes exceed the licence’s max_nodes, or you are multi-node without an HA licence. |
cluster:node_down | warning | cluster | An active roster node Patroni reports as not running or not tracked. |
cluster:phantom_node | warning | cluster | A replica is streaming under a name matching no active roster entry — a name drift, or a decommissioned node still physically running. |
cluster:replica_lag | warning | cluster | A streaming replica’s replay lag is past the operator threshold (60 s by default). Leader-observed, and distinct from the readiness gate below. |
cluster:slot_invalid | error | cluster | A replication slot’s wal_status is unreserved or lost — the disk backstop fired and that replica must re-sync from a fresh basebackup. |
cluster:sync_degraded | warning | cluster | Synchronous replication is configured but has no in-sync partner right now, so commits may block. No-op on an async cluster. |
cluster:orphan_slots | warning | cluster | Replication slots match no active node and the reaper declined to auto-drop them (ambiguous, or still streaming). |
cluster:readiness | warning | per node | This node is too far behind (replay lag past 45 s, or no streaming at all), so its daemon-config reloads are frozen on the last-good version. Authentication keeps serving from the daemon caches. |
cluster:readiness_blind | error | cluster | The app role cannot read pg_stat_replication’s progress columns — it needs pg_read_all_stats. The readiness gate and cluster-status health are running blind. |
cluster:replication_grant | error | cluster | The app role lacks the REPLICATION attribute, so the orphan-slot reaper cannot drop slots. |
cluster:nac_session_drop:<node> | error | per node | The NAC daemon on that node permanently dropped session-accounting writes after exhausting retries against the primary during a prolonged failover. Event-type: auto-resolves on the TTL. |
The freeze behind cluster:readiness is immediate; the alert waits out a further 60-second grace so a blip does not flap it. The health reconciles run every 60 seconds on the leader, the licence and phantom/grant reconciles hourly, and the slot reaper every 10 minutes.
See High availability for the cluster architecture behind all of these.
Notification channel: email
Section titled “Notification channel: email”Notifications are sent on transitions and on repeats — never on every evaluation cycle. Taranac mails a configured recipient list when:
- an alert fires (newly opened, or just escalated) and its severity is at or above
alerts.notify_min_severity; - an alert is still firing, unacknowledged, and its per-severity repeat interval has elapsed (a reminder);
- an alert resolves after having been notified (the “all clear”), if
alerts.notify_on_resolveis on.
Acknowledging an alert stops the repeat reminders for it — that is the primary noise-control lever. Repeat cadence is set per severity, so critical conditions nag often and warnings rarely.
The notification pass runs at the end of each evaluation cycle, from stored state — so it also covers alerts opened by producers outside the evaluator (backups, MFA, the cluster reconciles, the Configuration Tracker). Delivery is best-effort: a mail failure is logged, never breaks evaluation, and (via the email self-check above) surfaces as its own alert.
Recipients are edited one address per line under Settings → System → Alerts and stored as a comma-separated list. The channel stays off entirely unless alerts.notify_email_enabled is on, SMTP is enabled, and at least one recipient is configured.
Alert notification emails are rendered in English regardless of the interface language.
Working alerts in the admin UI
Section titled “Working alerts in the admin UI”Logging & Reports → Alerts lists conditions most-severe-first, then most recent, opening on the firing view. Summary tiles across the top count critical / error / warning / all-firing / resolved, and clicking one applies it as a filter. From there:
- Filter by status (firing / resolved), severity, source, acknowledgement, or a text search across title, message, source and fingerprint. On an HA cluster the list also shows a Node column and a node filter, so you can see and narrow to which node raised each alert. The Source dropdown offers the monitoring and config-validation sources; for the rest (
backup,mfa,domain,license,cluster_*,ncm_*) use the search box, which matches the source and fingerprint text. - Acknowledge a single alert (or Acknowledge all firing ones) to silence its repeat emails while you work it. The alert stays firing; the system records who acknowledged and when.
- Resolve an alert manually when you have decided it is handled. If the underlying condition is still bad, the next detection simply opens a fresh alert — so manual resolve is safe, not a way to hide a live problem.
Access is governed by RBAC under the alerts section: view to see the list and stats, acknowledge to acknowledge, and manage to manually resolve. The built-in operator role has all three; auditor is view-only. Alerts cannot be created through the UI or API — only the background producers listed above open them.
Common scenarios
Section titled “Common scenarios”A disk is filling up. /var crosses 80%, persists past the debounce, and a warning opens (disk:/var). You get a firing email. It keeps climbing past 90%, the alert escalates to critical, your earlier acknowledgement is cleared, and you are notified again. You free space; on the next cycle the metric drops and the alert auto-resolves with an “all clear” mail.
RADIUS goes down. The health check fails and a critical alert fires immediately (no debounce), since authentication is impacted. You acknowledge to stop the repeats while you investigate, fix the daemon, and the alert resolves on the next reachable check.
A daemon is up but refusing everything. A node loses its database. The port still answers, so service:tacacs stays quiet — but the daemon reports that it is refusing, and after 30 seconds service:tacacs_backend opens as critical on that node only. Requests refused during the window are recorded and replayed into the AAA log once the database is reachable, so the gap is visible afterwards rather than lost. A routine container recreate never reaches that alert: the daemon’s cache warm-up is over inside the grace.
A password-spray against a user. Failed PEAP logins for jdoe cross the NAC threshold inside the window; a warning fires (nac:brute_force:peap:jdoe). The device is not banned — the alert tells you to investigate and, if warranted, block the endpoint manually. When the spray stops, the alert ages out and auto-resolves.
A switch you forgot to onboard. A NAS not in inventory hits the NAC path; a throttled unknown_device warning fires for that NAS IP. You add it under Network devices, and the alert clears once the requests stop.
Bad config push. A TACACS+ profile change fails validation; an error opens (tacacs_config:validation). You correct the profile, the reload validates cleanly, and the alert resolves.
When to use which control
Section titled “When to use which control”| Goal | Use |
|---|---|
| Stop being reminded about something you are already handling | Acknowledge the alert (keeps it firing, silences repeats) |
| Mark a condition handled and clear it from the active list | Resolve it manually (a live condition just reopens) |
| Hear about more / fewer alerts by email | alerts.notify_min_severity (e.g. error to mute warnings) |
| Reduce reminder frequency | alerts.repeat_*_minutes (set 0 to disable repeats for a severity) |
| Stop nuisance resource alerts on a busy box | Raise the relevant *_warning_percent / *_critical_percent, or set 0 to disable a level |
| Tame momentary spikes | Increase alerts.sustained_minutes (the debounce) |
| Stop all alert email | alerts.enabled = false — see the caveat below |
Settings reference
Section titled “Settings reference”All alert settings live under alerts.* and are edited under Settings → System → Alerts. Resource thresholds are percentages where 0 disables that level; repeat intervals are in minutes where 0 disables repeats for that severity.
| Key | Default | Purpose |
|---|---|---|
alerts.enabled | true | Master switch for evaluation, lifecycle and notifications |
alerts.eval_interval_seconds | 60 | How often conditions are evaluated |
alerts.sustained_minutes | 2 | Debounce — how long a resource breach must persist before opening |
alerts.resolved_retention_days | 30 | Days to keep resolved alerts (0 = keep forever) |
alerts.event_ttl_minutes | 60 | Idle period after which event-type alerts (brute-force, unknown device, dropped NAC session writes) auto-resolve |
alerts.disk_warning_percent / _critical_percent | 80 / 90 | Disk usage thresholds |
alerts.cpu_warning_percent / _critical_percent | 90 / 0 | CPU usage thresholds |
alerts.mem_warning_percent / _critical_percent | 85 / 95 | Memory usage thresholds |
alerts.swap_warning_percent / _critical_percent | 0 / 0 | Swap usage thresholds (off by default) |
alerts.email_failure_threshold | 3 | Email-delivery self-check trip point (0 disables) |
alerts.notify_email_enabled | true | Email notification channel on/off |
alerts.notify_recipients | (empty) | Recipient addresses — one per line in the form, stored comma-separated |
alerts.notify_min_severity | warning | Minimum severity that triggers an email |
alerts.notify_on_resolve | true | Send the “all clear” on resolve |
alerts.repeat_critical_minutes | 60 | Reminder cadence for unacknowledged firing critical |
alerts.repeat_error_minutes | 360 | Reminder cadence for unacknowledged firing error |
alerts.repeat_warning_minutes | 1440 | Reminder cadence for unacknowledged firing warning |
The same page also carries one key from outside the alerts.* namespace:
| Key | Default | Purpose |
|---|---|---|
notifications.retention_days | 30 | Days to keep processed rows in the daemon→backend alert bridge table before they are rotated out (0 disables the rotation) |
NAC brute-force detection is tuned separately under nac.*:
| Key | Default | Purpose |
|---|---|---|
nac.bruteforce_enabled | true | Enable NAC (802.1X) brute-force detection — alert-only, never bans |
nac.bruteforce_threshold | 10 | Failed credential auths per identity within the window before alerting |
nac.bruteforce_window_minutes | 15 | Detection window per identity |
Related
Section titled “Related”- Audit & syslog — the event trail behind delivery self-checks and operator actions
- Authentication logs — the per-request log that brute-force counters draw from
- Network devices — onboard a NAS to clear unknown-device alerts, and the inheritance chain behind the key/banner advisories
- Endpoints & profiling — the block lifecycle that NAC enforcement actually uses
- High availability — the
cluster:*andservice:*_backendalerts in their operational context - Backups & upgrades — the
backup:scheduledandbackup:incompletealerts - Multi-factor authentication — the provider health checks behind
mfa:<provider> - Settings reference — SMTP configuration for the email channel
- Taranac on GitHub