

Audit & syslog
Taranac keeps an immutable audit trail of every administrative change — who did what, to which object, from which IP, and when — and can forward both that trail and the live AAA logs (TACACS+, RADIUS, NAC) to an external syslog server or SIEM, along with its own alert notifications. Together these cover the two questions every audit asks: what happened inside the admin console and can we prove it to an external, tamper-resistant system.
The audit log answers the first question on its own and is always on — there is nothing to enable. Syslog forwarding answers the second: you point Taranac at a collector (Splunk, Elastic, Graylog, rsyslog, QRadar, etc.) and choose which event streams it should ship.
<182>1 2026-06-24T12:34:56Z taranac USER_DELETED [taranac actor="admin" targetType="user" src="10.0.0.5"] Key concepts
Section titled “Key concepts”| Term | What it means in the UI |
|---|---|
| Audit log | The append-only record of admin actions (create / update / delete, logins, config reloads, secret reveals). Viewed under Logging & Reports → Activity Log, never editable. |
| Audit event type | A stable code such as USER_DELETED, DEVICE_SECRET_REVEALED, TACACS_CONFIG_RELOADED. You filter the log by it. |
| Actor / target | Actor is the admin who performed the action (blank for system-generated events); target is the object affected (its type and ID). |
| Syslog destination | An external syslog/SIEM endpoint — host, port, transport, format. Configured under Settings → Integrations → Syslog. |
| Log binding | A rule attached to a destination saying which stream to send there (e.g. system:audit, tacacs:authorization, system:alerts). Without a binding, nothing is sent. |
| Log exclusion | A separate rule that suppresses noisy AAA events; one of its toggles controls whether matching events reach syslog. |
The admin activity / audit log
Section titled “The admin activity / audit log”Every state change in Taranac calls into a single audit service, which writes one immutable row and then (fire-and-forget) hands the event to syslog forwarding. Each entry records:
- Event type — one of more than 350 codes, and the catalogue grows with almost every release. They are grouped by domain: user lifecycle, groups, RBAC, authentication, MFA, crypto/settings, licensing, LDAP config and sync, the Active Directory domain join, network objects, devices, TACACS+/RADIUS templates / profiles / command sets / config, AAA policy, log exclusions and syslog, NAC (endpoints, classification, policy, PKI and EST enrolment, captive portal), Reports and datasets, Configuration Tracker inventory / credentials / collection runs, cluster and HA operations, backups, workers, log rotation, and secret reveals. The full list is deliberately not reproduced here — it is long, it changes every release, and the log’s own filter and search are the authoritative index.
- Actor — username snapshot plus user ID; empty for automatic/system events.
- Target — type and ID of the affected object, plus a target username snapshot where the target is a user. The viewer shows it under the target type, and the search box matches it.
- IP address and user agent of the caller — on every entry written while serving a web-interface or API request, whatever the event. The address is read through the reverse proxies counted by
TRUSTED_PROXY_HOPSin.env, as login and the rate limits read it; seeTRUSTED_PROXY_HOPS. Events the system writes by itself (scheduled jobs, the daemons) have neither. - Details — an event-specific JSON payload. For updates this typically records what changed as old → new field diffs, so a row is self-explanatory without cross-referencing. It also carries the discriminator that makes an ambiguous event readable: a
USER_LOGIN_FAILEDrow, for instance, carries areason, andweb_login_deniedthere means the credentials were right but the account’s group is barred from the web console — not a bad password. - Node — on an HA cluster, the node that wrote the entry, stamped best-effort. It is left blank on a standalone install (and for events written before the cluster resolver is available at early boot). Surfaced as a Node column in the audit viewer, with a matching node filter that appears only once a cluster has more than one node. The LDAP directory sync runs on the leader only, so a scheduled sync writes one set of
LDAP_SYNC_*rows per cluster, not one per node. - Timestamp — server time, timezone-aware.
The actor and target are stored as snapshots: even if you later rename or delete the user or object, the audit row still shows who and what it was at the time.
A few events are worth knowing by name, because they are the ones an investigation reaches for:
| Event | When it is written |
|---|---|
NAC_PKI_EST_ENROLLMENT | Every EST enrollment outcome: issued, queued for approval, approved, rejected — and refused. A refused row carries a reason, the client’s address and User-Agent, the gateway’s certificate verdict (for example FAILED:certificate revoked) and the presented certificate’s serial and subject. See Refused enrollments. |
USER_LOGIN_FAILED with via: est | A wrong password on EST enrollment. It does not count towards the account’s lockout: wrong EST passwords count against the source address instead (the enrollment guard). |
NAC_PKI_SCEP_ENROLLMENT | Every SCEP enrollment outcome, as NAC_PKI_EST_ENROLLMENT for EST. See SCEP enrollment. |
NAC_PKI_ENROLLMENT_SOURCE_BLOCKED · NAC_PKI_ENROLLMENT_SOURCE_UNBLOCKED | The enrollment guard blocked an address (an IPv6 /64) from EST or SCEP after five wrong passwords or challenges in 15 minutes, with the protocol, the last identity tried and the end of the block — or an operator clicked Unblock. See The enrollment guard. |
TACACS_SERVER_CERT_RESTORED · NAC_PKI_SERVER_CERT_RESTORED | Restore previous made an earlier TACACS+ or NAC server certificate the active one again and deployed it. See TACACS+ over TLS and PKI. |
LDAP_ENDPOINT_DEACTIVATED · LDAP_ENDPOINT_DELETED | One entry per machine a computer sync deactivates or deletes, with its MAC address, DN and reason: not_found_in_ldap. See Deactivate and delete missing. |
Captive-portal guest events (AUP acceptance, approval, rejection and the rest) name the guest session by its ID. A guest’s session token, which would let its holder act as that guest, is never written to the audit log.
Filtering, searching and export
Section titled “Filtering, searching and export”The Activity Log view offers filters on event type, target type, a date range (from / to), and — on a multi-node cluster only — node, plus a free-text search across actor, target username, event type, target type and IP. The API accepts two more that the filter bar does not set: actor ID and target ID. Default sort is newest first (created_at descending); you can also sort by event type, actor, target type or target username.
The Event Type dropdown is a curated list of the ~90 most common codes, not the full catalogue. An event that is not on it is still recorded and still shown in the table — rendered as its raw code, e.g. GROUP_WEB_LOGIN_MODE_CHANGED or MFA_PUSH_EXPIRED — but you reach it through the search box or the API rather than the menu. The search matches event-type substrings, which is what you want for a class of events: SECRET_REVEALED finds every reveal, _DELETED every deletion. The dropdown filter, by contrast, is an exact match on one code.
You can export to XLSX or CSV, and the two scopes in the drawer are not two sizes of the same thing:
- Current view exports exactly what is on screen — the current page (at most 100 rows), with the active filters, search and sort applied. The drawer lists them as badges so there is no doubt what is being exported.
- All entries sends no filters — not the date range, not the event type, not the node. Only the sort carries over. You get the first 10,000 rows of the whole log in that order (the newest, by default).
The export columns are: ID, Time, Event Type, Actor, Target Type, Target ID, Target (the target-username snapshot), IP Address, User Agent, Node, Details. The headers are written in your interface language. Times are in the system time zone the UI shows — in CSV as ISO 8601 with the offset, in XLSX as real date-time cells you can sort and filter. A text cell that begins with =, +, -, @, a tab or a line break is written with a leading apostrophe, so a spreadsheet shows it as text and never runs it as a formula — audit text such as a failed login’s username is supplied by whoever tried it.
When an export reaches the 10,000-row ceiling, the drawer stays open with a warning that says how many rows the file holds out of how many matched, instead of reporting success — a cut file is never mistaken for the whole log. Through the API, the same signal is the X-Taranac-Export-Truncated: true response header, beside X-Taranac-Export-Rows and X-Taranac-Export-Total.
Exporting needs its own permission, audit_logs.export — reading the log (audit_logs.view) does not include taking a copy of it. Without it the Export button is not shown and the endpoint refuses the download. The built-in auditor and operator roles hold it; the read-only demo role does not. See Roles & permissions.
Every export is itself audited, as a DATA_EXPORTED entry carrying the format, the scope, the filters, how many rows the file holds and whether it was cut. The entry is written after the rows are read, so a file never contains its own export record. The same holds for the AAA and NAC log exports, which go through the same pipeline.
Retention, and the archive before deletion
Section titled “Retention, and the archive before deletion”Audit rows are not partitioned like the AAA logs; they are deleted row by row, by date. A job runs daily at 03:00 and removes everything older than audit_log.retention_days — default 365. A value of 0 or less disables deletion entirely.
Optionally the rows about to go are archived first: turn on audit_log.archive_enabled and set audit_log.archive_path (default /data/audit-archive), and each run writes an audit_archive_<timestamp>.jsonl file carrying every field — details included — before the delete runs.
Both live under Settings → System → Log Rotation, where the audit log appears in the Security group with a row delete mechanism rather than a partition count, and the archive toggle and path have their own Audit log archive card. Editing either needs settings.edit.
The purge audits itself. Every run writes an AUDIT_RETENTION_PURGE row — a system event, so no actor — recording how many rows were deleted, the cutoff timestamp, and the archive path if one was written. A run that deleted nothing still writes it. A gap at the old end of the trail therefore has a row in the trail explaining it.
Forwarding to an external syslog / SIEM
Section titled “Forwarding to an external syslog / SIEM”Forwarding is built around three objects — destination (where), binding (what), exclusion (what to suppress) — feeding three independent delivery paths.
Three delivery paths
Section titled “Three delivery paths”| Path | Carries | How it ships | Latency |
|---|---|---|---|
| A — core events | system:audit, system:config_change | Pushed in real time from the audit write-path, fire-and-forget | Immediate |
| B — AAA daemon logs | tacacs / radius / nac (authentication / authorization / accounting) | A background forwarder reads new rows from the log tables and ships them on a short interval | Up to about a minute: a 20 s job interval plus a 30 s safety lag, so rows still settling from the daemons’ batch writes are never skipped |
| C — alert notices | system:alerts | Sent by the alert engine’s notification pass when an alert fires, repeats or resolves, under the shared notification policy; a notice a destination did not accept is retried | At the end of the alert evaluation cycle (every 60 s by default) |
All three use the same formatter and sender, so everything looks identical on the wire. Path B exists because the AAA daemons write their logs straight into the database; the backend owns those tables and is the natural place to forward from. (Notably, the bundled FreeRADIUS cannot send to a remote syslog itself, so doing it in the backend gives one consistent mechanism across all three protocols.)
On a cluster, each record is sent once. Every node runs the Path B forwarder, and each forwards the TACACS+, RADIUS and NAC records of the requests it served itself — the daemons stamp every row with the node that received it — from cursors of its own, so no two nodes ever ship the same row. The leader additionally forwards the records no active node owns: rows with no node stamp, or stamped by a node that has since left the roster. A node that cannot yet tell which node it is (the moment before its roster row exists at boot) skips its pass rather than guess; its cursor simply waits. Path A is sent by the node that wrote the audit entry, and Path C by the node that owns the alert (see Who sends what on a cluster). The syslog header names the sending node — see The HOSTNAME field.
The forwarding ceiling, and what a drop looks like
Section titled “The forwarding ceiling, and what a drop looks like”Path B’s window has an upper bound that moves with the wall clock and a cursor that does not, so after any downtime the untouched range is exactly as wide as the outage. Sent in one burst — one message per record per destination — that range would be, on a large estate, not a slow catch-up but a second outage, arriving at the moment the system comes back.
So a pass reads at most syslog.forward_max_rows_per_run rows per source log table, default 5,000. It is an ordinary system setting, and it is clamped when read to the band 100–100,000 — so a mistyped value can neither stall the forwarder (0 or negative) nor restore the unbounded behaviour. Raise it to catch up faster after downtime; lower it if the receivers are slow.
When a pass stops at the ceiling:
- the cursor is advanced to the last row actually read, never to the window’s far edge, so the tail of a truncated window is not silently discarded;
- the position is a keyset over
(timestamp, id), so a batch of rows sharing one timestamp resumes inside the group instead of skipping its remainder forever; - the job starts the next pass immediately rather than waiting out its interval, up to 4 passes per 20-second tick. Whatever is still queued waits for the next tick, and the service log says so.
A backlog is therefore drained steadily over several passes instead of all at once, and nothing in it is skipped.
Delivery, though, is deliberately decoupled from the cursor — and this is the part to plan for. The cursor is one per source table (and node) and shared by every destination, so blocking it on delivery would let a single dead SIEM stall the stream for all the others and then flood the healthy ones on recovery. Instead the cursor always advances: nothing is queued and nothing is retried. What a destination did not take is gone. A destination that fails 5 sends in a row has the remainder of that batch abandoned rather than costing a 10-second TCP timeout per remaining message — those records are still counted as lost.
The loss is made visible rather than hidden. Each destination row carries its own delivery state, updated once per pass:
| Field | What it tells you |
|---|---|
last_delivered_at | When this destination last accepted anything |
consecutive_failure_count | How many passes in a row lost something here; a clean pass resets it to 0 |
dropped_record_count | Running total of messages this destination never received |
Any shortfall is also written to the service log as a WARNING naming the destination and the count. Destinations are tallied independently, so an unreachable receiver cannot make a healthy one’s numbers look worse.
Step 1 — create a destination
Section titled “Step 1 — create a destination”Under Settings → Integrations → Syslog, add a destination and set:
| Field | Notes |
|---|---|
| Host / port | Hostname or IP; default port 514. |
| Transport | udp or tcp. |
| TLS (TCP only) | Optional CA cert, client cert and client key for mutual TLS, plus a verify toggle. The stored client key is shown back as a sentinel, never in clear. |
| Format | The Syslog Standard: RFC3164 (BSD, single line), RFC5424 (modern, structured data), or CEF (ArcSight / Common Event Format). Default RFC3164. |
| Facility / severity | Default local6 / info. |
| Ident | Syslog tag / app name; default taranac. |
| Source IP spoofing (UDP only) | Off by default. When on, messages leave with the originating NAS device’s IP as the source address instead of the Taranac server’s, so a collector can attribute a line to the switch it came from. It needs raw-socket privileges (CAP_NET_RAW) on the host, and is refused outright for TCP. |
| Enabled | Disabled destinations send nothing. |
Use Test on the destination to send a probe message and confirm the collector receives it before relying on it. A failed test names the class of failure — timeout, name resolution, connection refused, TLS — and the full error goes to the api log. Over UDP a successful test only proves the datagram left the host.
Step 2 — add bindings
Section titled “Step 2 — add bindings”A destination is silent until you bind streams to it. Each binding picks a module and a log type; valid combinations:
| Module | Log types |
|---|---|
system | audit, config_change, alerts |
tacacs | authentication, authorization, accounting |
radius | authentication, accounting |
nac | authentication, accounting |
Each binding can optionally override the destination’s facility or severity, which is handy for routing one stream to a different SIEM index. A binding is unique per (destination, module, log type).
Step 3 — control noise with exclusions
Section titled “Step 3 — control noise with exclusions”Log exclusions suppress chatty AAA events (a polling monitor hitting a switch every minute, a service account, an entire subnet). An exclusion matches on who (exact username, username regex, or user group), where (any NAS, a specific network object, or a device group), scope (all / tacacs / radius) and which event types (authentication / authorization / accounting). It then has three independent output toggles:
| Toggle | Effect |
|---|---|
exclude_from_db | The event is not written to the database log tables. |
exclude_from_syslog | The event is not forwarded to syslog (enforced by Path B). |
exclude_from_alerts | The event does not trigger alerts. |
These toggles are independent — you can keep events in the database for forensics yet stop them flooding the SIEM. The on-disk file backup of AAA logs is always written regardless of exclusions, so suppressing syslog never means losing the forensic copy.
What gets emitted, and in what format
Section titled “What gets emitted, and in what format”The PRI value is computed the usual way: facility * 8 + severity. Severity is chosen automatically per event:
- Audit events map by type, from three fixed lists. Six failure events (
USER_LOGIN_FAILED,PASSWORD_RESET_FAILED,EMAIL_FAILED, the TACACS+ and RADIUS reload failures,LDAP_SYNC_FAILED) →err. Fifteen security-significant events (USER_DELETED,GROUP_DELETED,RBAC_MODEL_DELETED,LDAP_CONFIG_DELETED,USER_LOCKED,MFA_DISABLED,MFA_RESET,KEY_ROTATED,USER_PASSWORD_RESET_BY_ADMIN,LDAP_USER_DEACTIVATED,LDAP_GROUP_REMOVED, and the device, device-group, TACACS+-settings and RADIUS-settings secret reveals) →warning. Thirteen operational events (logins, logout, new-IP login, the three config reloads, LDAP sync start/finish, data import/export, worker pause/resume/interval change) →notice. Everything else →info. - AAA events — authentication failures/rejects and authorization denies →
warning; accounting is alwaysinfo. - Alert notices follow the alert’s own severity —
critical→crit,error→err,warning→warning— and every resolved notice isnotice. See Notification channel: syslog.
A destination’s or binding’s facility/severity override takes precedence over these defaults.
RFC3164
Section titled “RFC3164”A single line, control characters stripped:
<PRI>Mmm dd HH:MM:SS hostname taranac: event=USER_DELETED actor=admin target_type=user src=10.0.0.5RFC5424
Section titled “RFC5424”Includes a structured-data block your SIEM can parse without regex:
<PRI>1 2026-06-24T12:34:56.000000Z hostname taranac - USER_DELETED [taranac eventType="USER_DELETED" actor="admin" targetType="user" targetId="…" src="10.0.0.5" details="{…}"] event=USER_DELETED actor=admin target_type=user src=10.0.0.5For AAA records the structured data carries protocol, log type, and the relevant fields (username, NAS IP/port, status/action, service, command, rule, profile, session ID). Audit details are serialized as compact JSON and truncated to ~1 KB to keep messages within syslog limits.
A TACACS+ authentication record with a reject reason — a refused connection among them — adds it to the message as reason=<code>. A row that folds several refused connections from one address also carries refused_connections=<count> and first_seen=<UTC time of the first one>. In RFC 5424 structured data these are reject_reason, refused_connections and first_seen; in CEF, reason, cnt, and start / end for the interval the row stands for.
CEF (ArcSight)
Section titled “CEF (ArcSight)”Choose CEF to emit events in Common Event Format, wrapped in a syslog envelope — the dialect ArcSight, Microsoft Sentinel and many other SIEMs parse out of the box:
<PRI>Mmm dd HH:MM:SS hostname CEF:0|Taranac|Taranac|<version>|USER_DELETED|USER_DELETED|6|rt=1750766096000 cat=audit act=USER_DELETED suser=admin src=10.0.0.5 cs1Label=targetType cs1=user …The CEF header carries a fixed vendor and product of Taranac, the running app version, a signature ID and a name (both the event_type for an audit event; for an AAA log the signature ID is PROTOCOL_LOGTYPE, e.g. TACACS_AUTHENTICATION, and the name is the readable pair, tacacs authentication), and a severity mapped to CEF’s 0–10 scale. The extension carries typed fields — real IPs go into src / dvc, and free-form values into labelled custom strings (cs1…cs6 with csNLabel), so a SIEM never has to guess a field’s type.
The detail that matters for correlation: every CEF event leads with the canonical rt (event-time) field — epoch milliseconds of when the event happened, derived from the same UTC instant as the header timestamp. Your SIEM never has to reconstruct the time from the year-less, timezone-less BSD header, so a slow collector or a timezone gap can’t smear your timeline.
The HOSTNAME field
Section titled “The HOSTNAME field”Every message — RFC 3164, RFC 5424 and the CEF envelope alike — carries the name of the node that sent it in its HOSTNAME field: TARANAC_NODE_NAME from that machine’s .env, which under HA is the node’s Patroni member name. Only when that variable is empty does it fall back to the API container’s hostname. Characters syslog does not allow there (spaces, non-ASCII) are replaced with -.
The installer writes TARANAC_NODE_NAME=taranac-node-1, so out of the box every standalone server introduces itself to your SIEM by that same name. If several standalone installations report to one collector, give each a distinctive name: edit TARANAC_NODE_NAME in its .env and run ./taranac up -d. On a node that has never been part of a cluster the change renames the node in place — its history keeps its node attribution, and the rename is recorded as a CLUSTER_NODE_RENAMED audit entry. Do not rename a cluster member this way; under HA the name is the Patroni member name and is set when the node joins.
Because each record is sent by one node (see Three delivery paths), the HOSTNAME on a cluster tells you which node handled it: the node that wrote an audit entry, the node that served an AAA request — or, for the few AAA records no active node owns, the leader that forwarded them. The audit and AAA structured data carry no separate node field; read the header. Alert notices carry the alert’s node in their own fields as well (node in RFC 5424, dvchost in CEF).
The AAA logs the forwarder ships
Section titled “The AAA logs the forwarder ships”Path B forwards the same authentication, authorization and accounting records you see in the AAA log views. Those records carry snapshot fields (device name and groups, network object, user display name and groups) captured at log time, so they survive renames and deletions. On a cluster each record leaves once, from the node that served the request, with that node’s name in the syslog HOSTNAME.
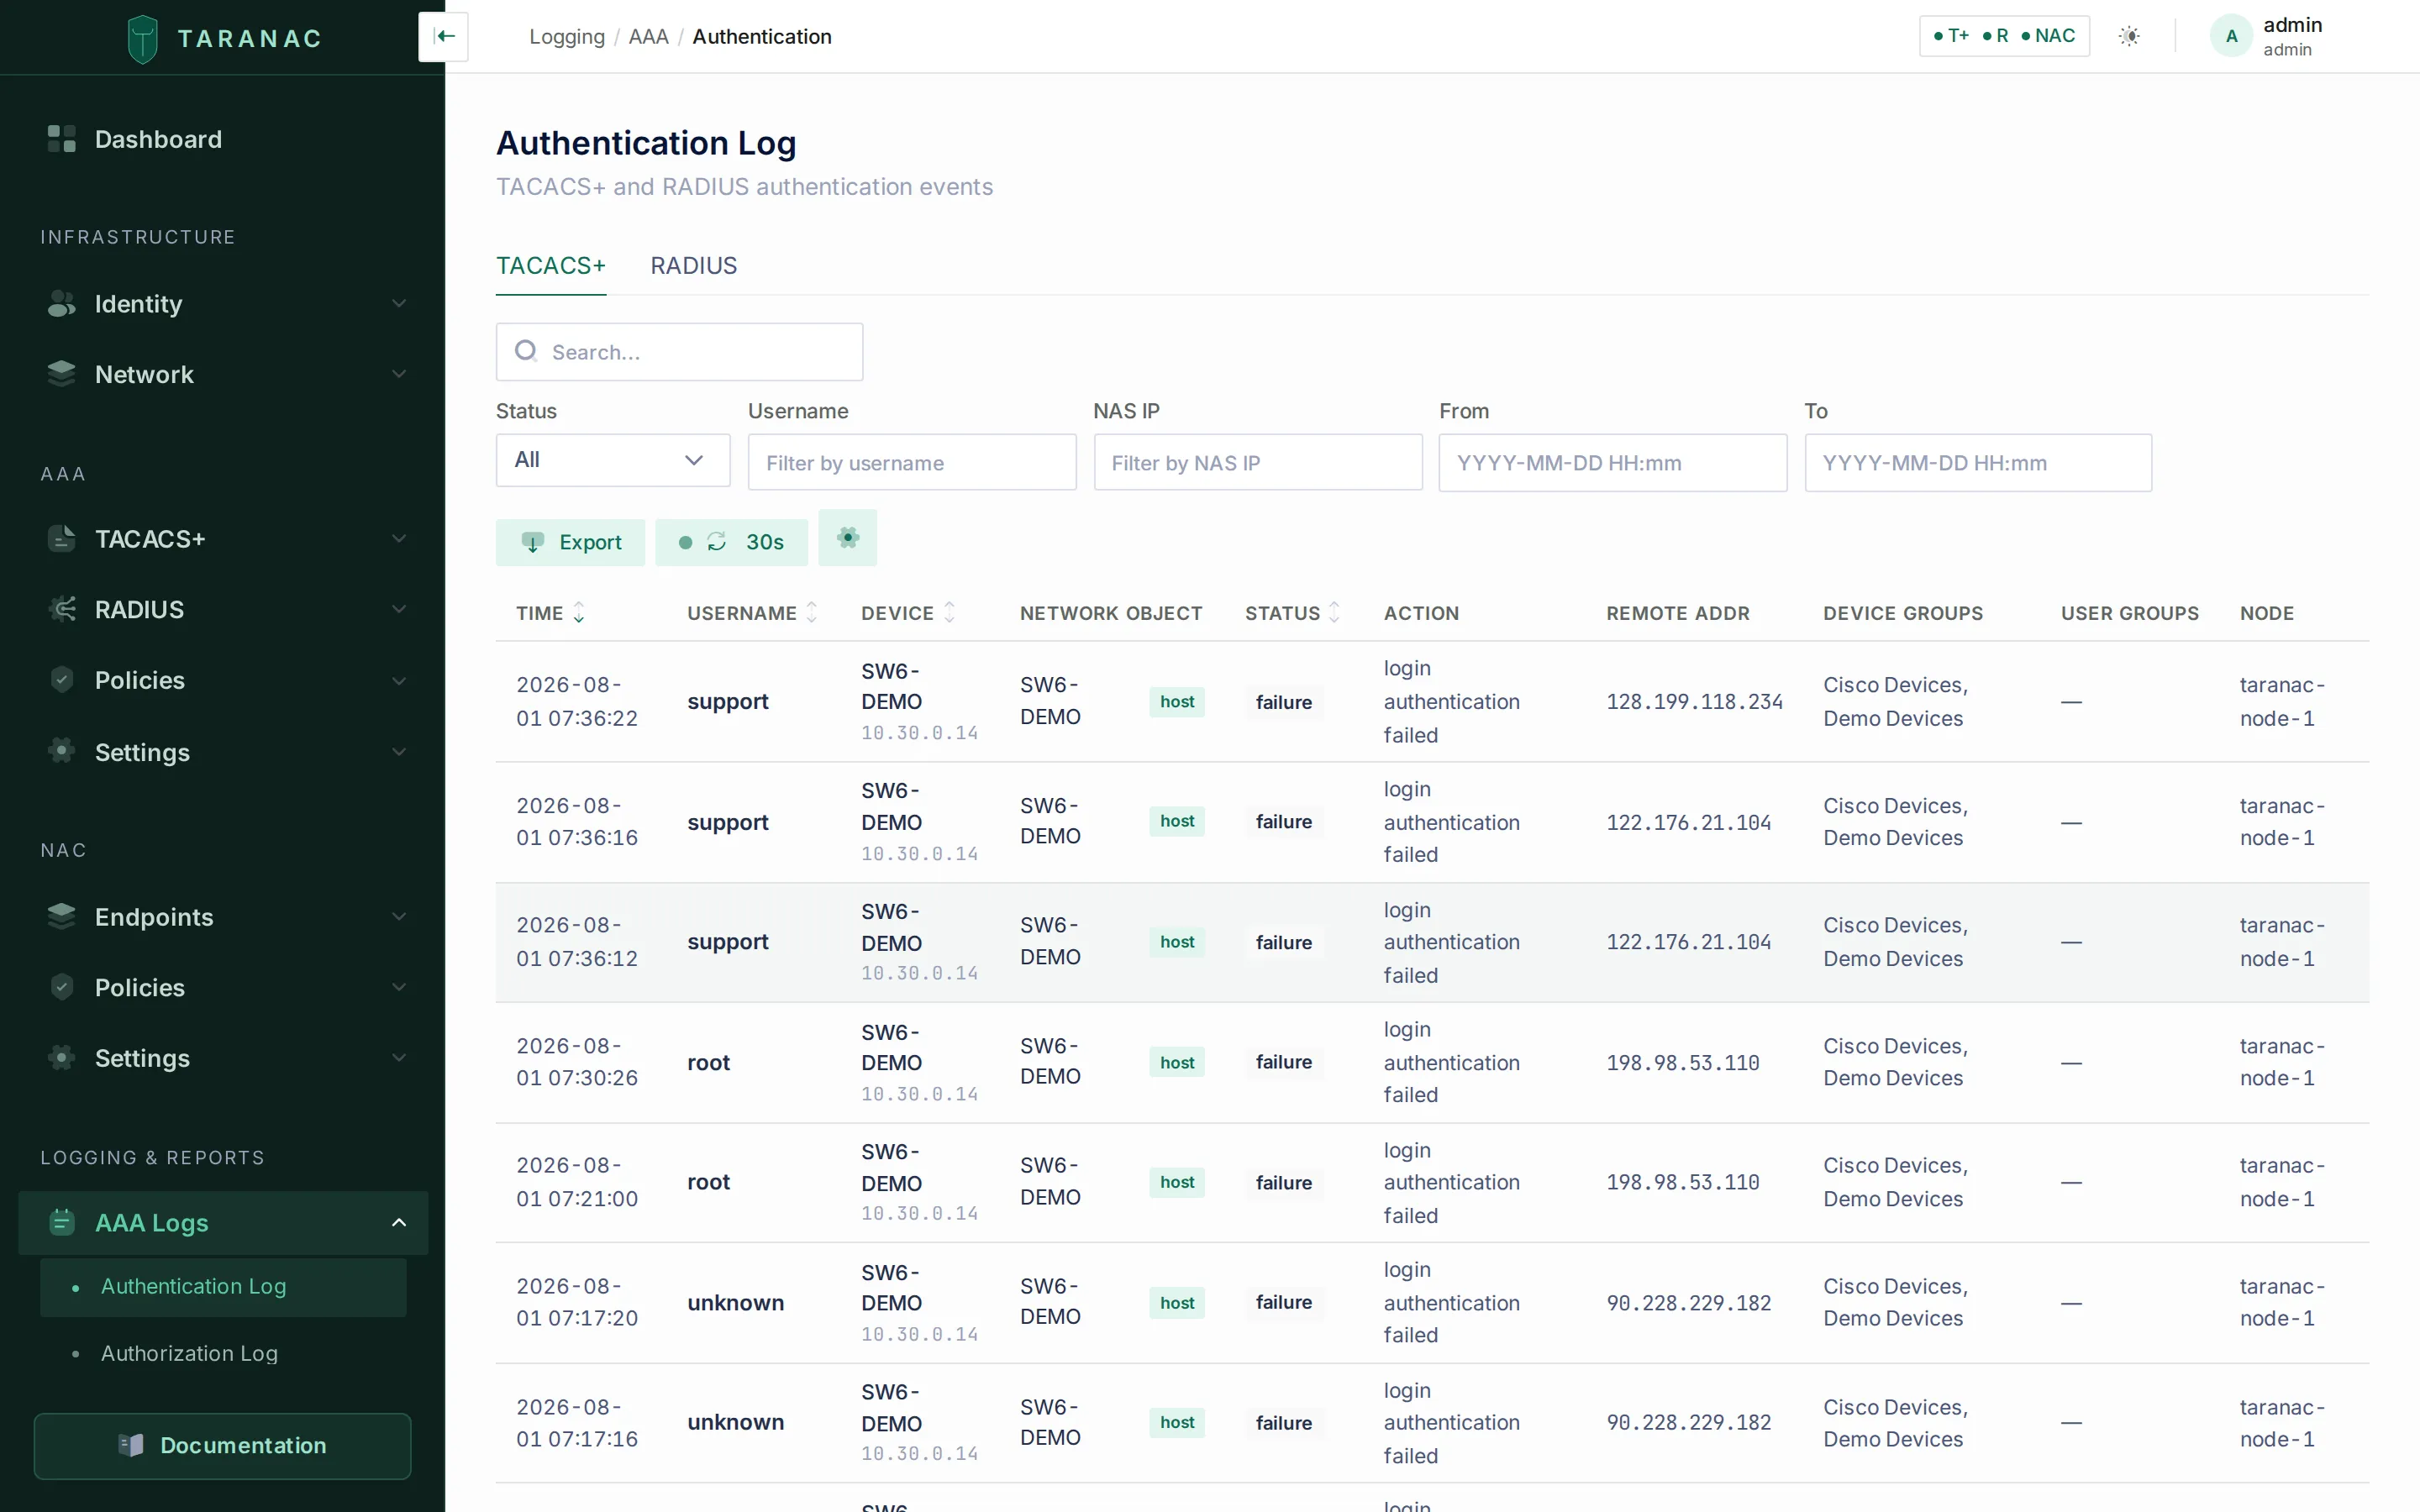 The authentication log: per-event who / where / outcome, with the same fields the forwarder ships to syslog.
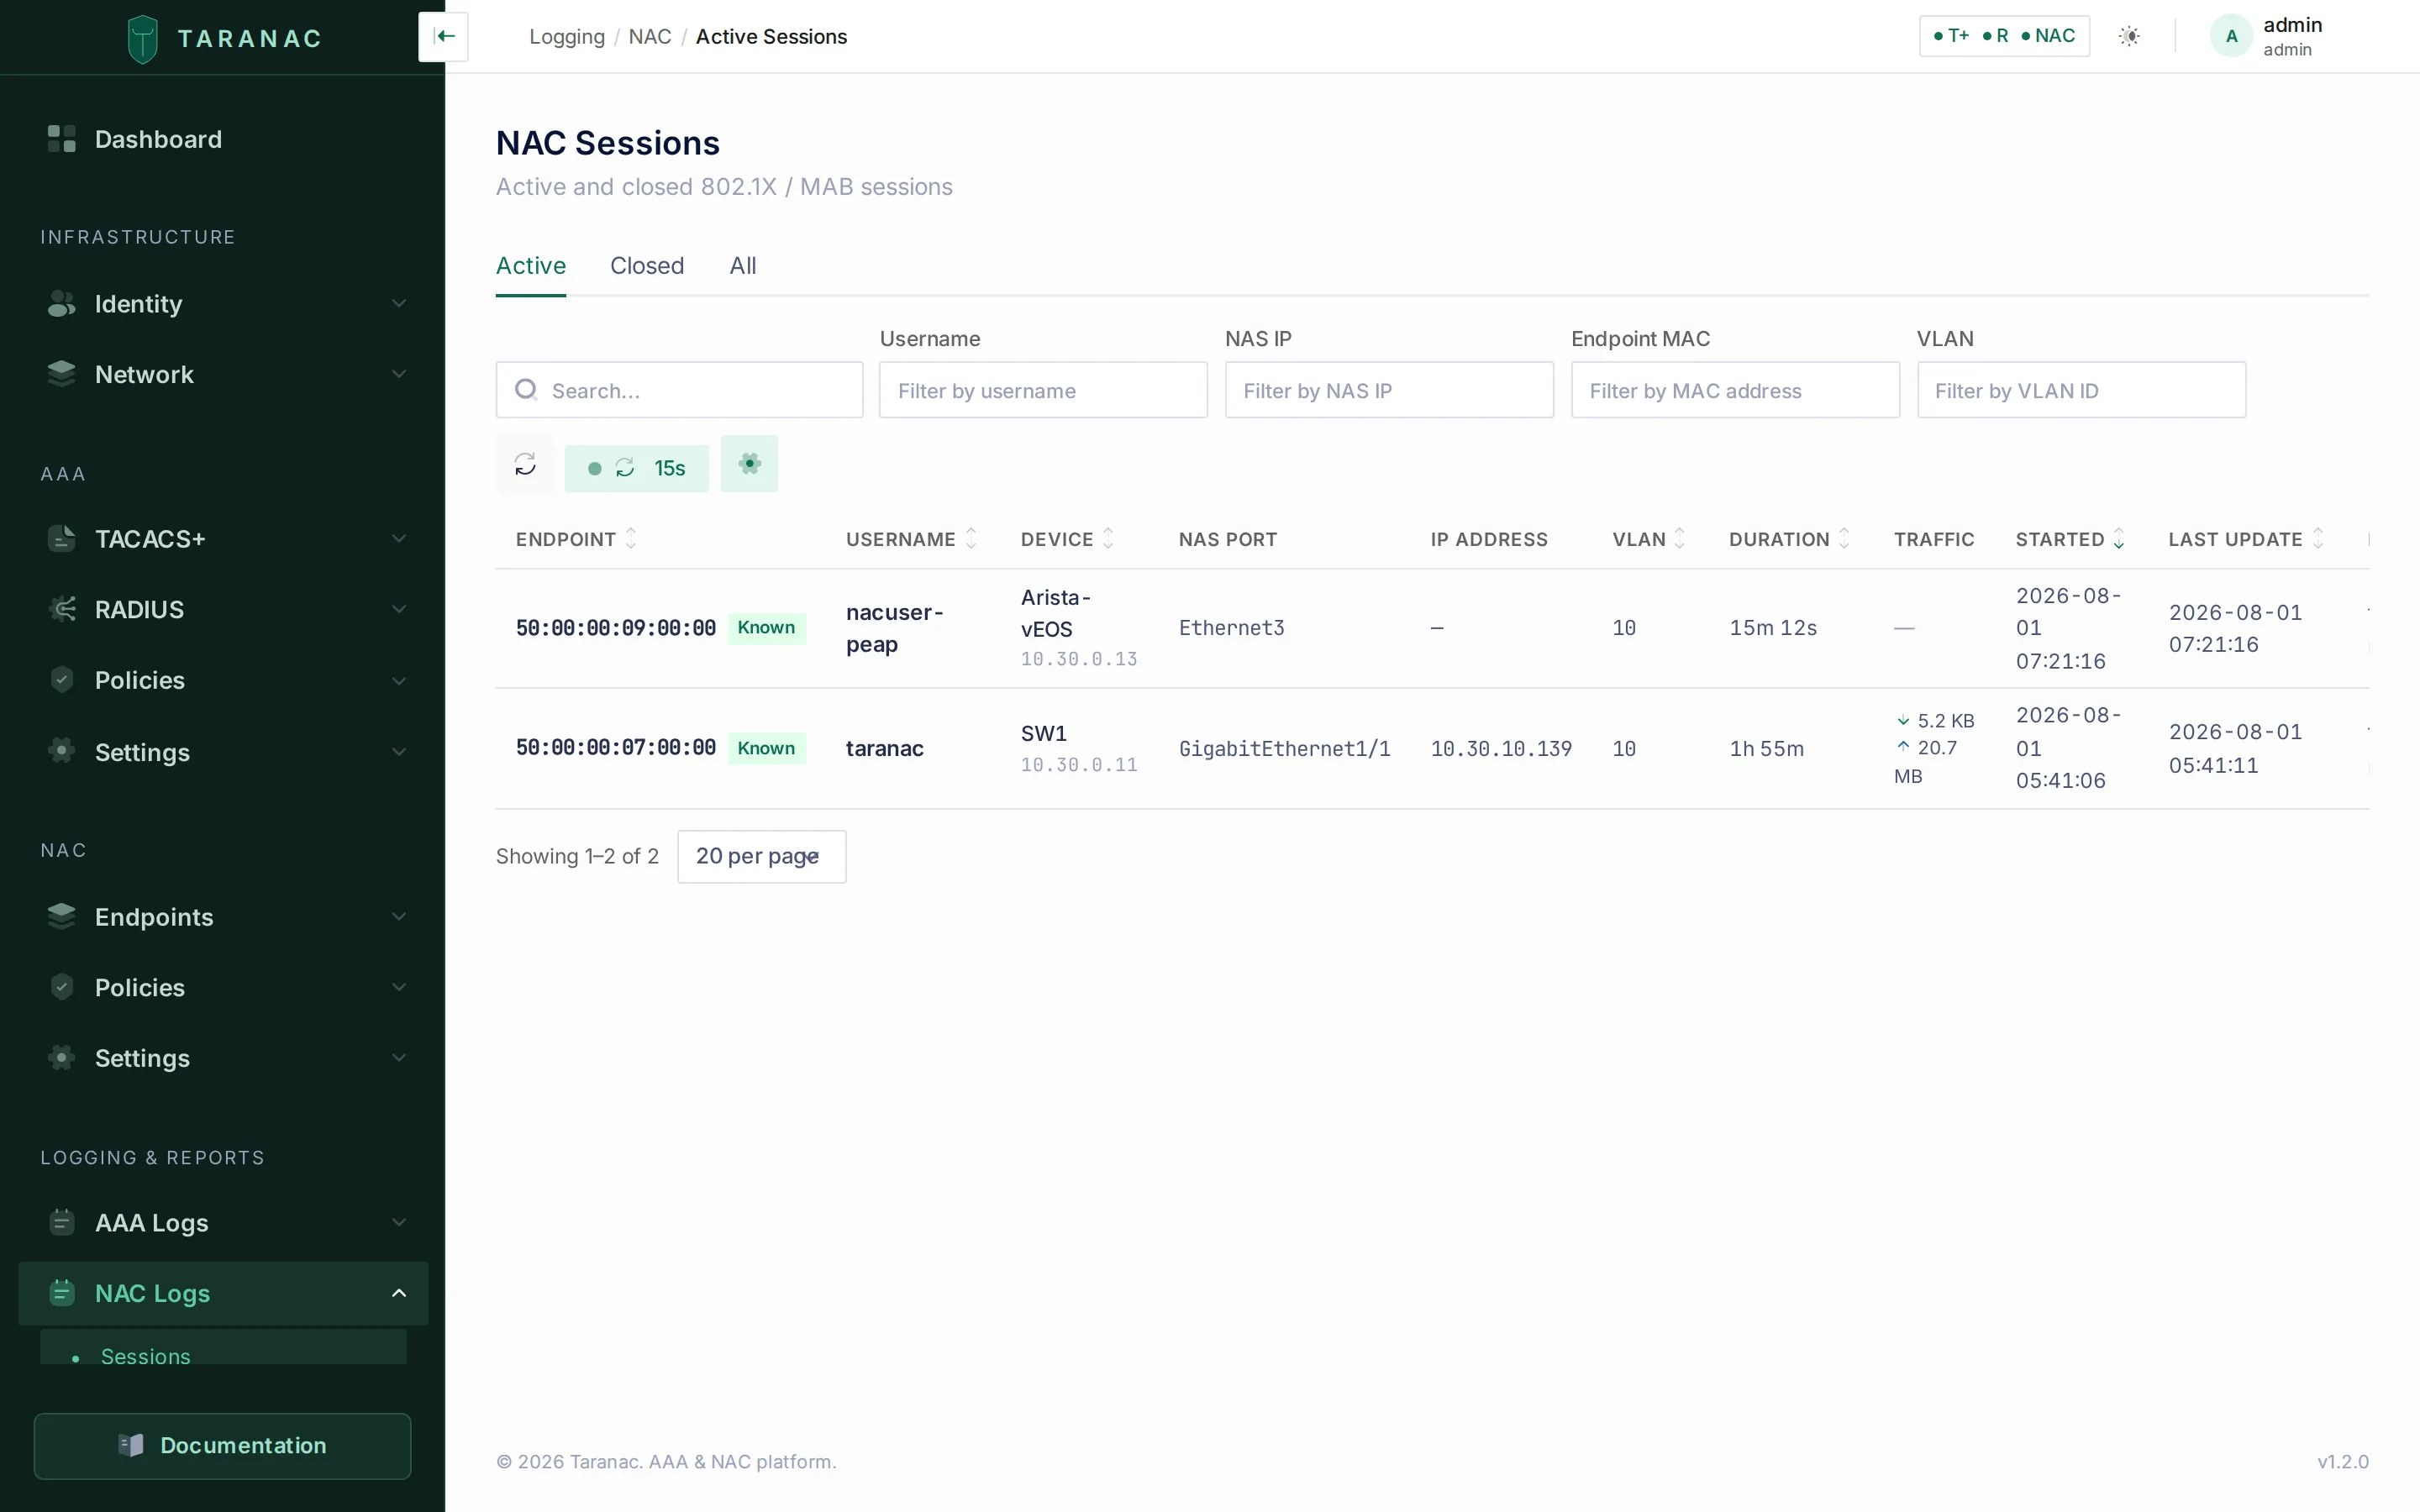 Active sessions are derived from accounting records — the
radius/nac accounting streams you bind for syslog.
When to use what
Section titled “When to use what”| You need to… | Use this |
|---|---|
| See who changed an object inside the console | Audit log, filtered by target or event type |
| Hand auditors a monthly record of admin actions | The export endpoint with date_from / date_to — the UI’s All entries scope drops every filter |
| Get admin actions into the SIEM in real time | A destination with a system:audit binding |
| Track only configuration / policy changes | system:config_change binding |
| Get Taranac’s alerts into the SIEM or the on-call pipeline | A system:alerts binding — firing, repeat and resolved notices under the alert notification policy |
| Stream TACACS+ command authorization to the SIEM | tacacs:authorization binding |
| Capture session start/stop for accounting/billing | radius:accounting and/or nac:accounting bindings |
| Stop a noisy monitor from flooding the SIEM but keep it on disk | Log exclusion with exclude_from_syslog on, exclude_from_db off |
| Mutual-TLS to a hardened collector | TCP transport + TLS certs on the destination |
| Check whether a SIEM is silently losing records | The destination’s dropped_record_count / consecutive_failure_count (API), or the WARNING in the service log |
| Tell several standalone servers apart in the SIEM | A distinctive TARANAC_NODE_NAME on each — it is the syslog HOSTNAME |
| Catch up faster after a long backend outage | Raise syslog.forward_max_rows_per_run above its 5,000 default |
Meeting audit requirements
Section titled “Meeting audit requirements”- Tamper-evidence — no operator action edits or deletes an audit row, and the one process that removes them (retention) leaves a record of what it removed. Forward
system:auditto an external, append-only SIEM as well, so the trail also lives somewhere the Taranac admins cannot reach at all. - Privileged-action visibility — every secret reveal (
*_SECRET_REVEALED), key rotation, MFA change and deletion is its own event type. Reach a whole class of them with the search box (which matches substrings) rather than the event-type dropdown (which matches one exact code, and lists only the commonest ~90). - Who took a copy — exporting the audit or AAA logs is its own permission (
audit_logs.export,aaa_logs_view.export), and every export leaves aDATA_EXPORTEDentry with its filters and row count. - Retention — the SIEM owns long-term retention. In-product, the audit log is kept for
audit_log.retention_days(default 365) and purged row-by-row nightly at 03:00, optionally written to a JSONL archive first; each purge leaves its ownAUDIT_RETENTION_PURGErow. The AAA database logs have their own per-protocol retention. - Completeness — keep the on-disk AAA file backup enabled (it ignores exclusions) so forensic data exists even for events you deliberately drop from the DB or SIEM.
Related
Section titled “Related”- Logging & accounting — the AAA log tables and views that Path B forwards
- AAA policy — the rules whose changes appear as
config_changeevents - Alerts — in-product alerting, the
system:alertssyslog channel, and the third exclusion output - Roles & permissions — the
audit_logsandsyslogpermissions that gate this section - Taranac on GitHub