

Reports
Taranac already records the things worth reporting on: every authentication and authorization decision, every endpoint session, every configuration snapshot, and the audit trail behind all of it. Reporting is what gets that out of the screens and into a document you can hand to someone — an auditor, a manager, a change board.
You never write SQL. Every query ships inside the product, and what you choose is which prepared question to ask and how to show the answer.
Three layers
Section titled “Three layers”Everything in reporting is one of three things, and they stack in one direction.
Templates are the prepared questions. Each one is a fixed query plus a declaration of what you are allowed to change about it — which time windows it offers, which columns can be sorted, how many rows it will return. Templates ship with the release: you cannot create or edit one, and you never have to maintain one. 43 templates are included — see the template catalogue.
Datasets are yours. A dataset is a template plus your choices: the period, the filters, and how the result should look. One template can back any number of datasets — TACACS+ authentication is a template; TACACS+ authentication, last 7 days, as a bar chart of the top ten devices is a dataset you name and keep.
Reports are multi-page documents composed of datasets — one dataset per page, in the order you set, with an optional title page and table of contents. A report is what you export as a branded PDF or put on a schedule.
The rule that keeps this predictable: everything that goes into a report is a dataset. There is no second path, no way to drop a raw template onto a page.
The one thing that reaches past a report is delivery. A schedule mails whole reports as PDF, but it can just as well mail a single dataset on its own — as a CSV, an XLSX or a PDF — without composing a report around it first.
What a fresh install already has
Section titled “What a fresh install already has”A new install is not an empty shelf. The first boot seeds 33 datasets over the template catalogue and composes 4 reports out of them — System overview, AAA activity report, NAC access report and Full platform report. Nothing is scheduled; delivery is always something you set up yourself.
That seed is one-time and watermarked. Rename, re-scope or delete any of it and your change sticks: the seed checks its watermark on every later boot and does nothing, so a deleted dataset never comes back on restart. Treat the set as worked examples to copy and adapt, not as fixtures the product keeps in step with you.
Two kinds of template
Section titled “Two kinds of template”Templates come in two kinds, and the difference is who decides what it looks like.
| Preset | Table | |
|---|---|---|
| The look is decided by | Taranac | you |
| You choose | the period, and which view | the period, chart type, columns, sorting, aggregation |
| Typical shape | a laid-out page — KPI tiles, donuts, trends, rosters | one flat result you shape |
| Exports to | PDF, CSV, XLSX |
A preset is a designed page. We author the layout in code and check it pixel by pixel, so a preset gives you a finished document rather than a chart you have to arrange. Some presets offer more than one view over the same data — AAA overview has a full dashboard and a bare totals row; NAC access overview has an outcome overview and a rejects-forensics view.
A table is open. The query is still ours, but the presentation is yours: show the rows as a table, collapse them into a bar or pie chart of one grouped column, or bucket a time column into a line. Those four forms are the whole set a table offers — the donuts, gauges and stat tiles you see in a preset are ours to draw, not yours to pick. The template declares each column’s role — dimension or measure — and which columns may be grouped, sorted or bucketed at all, so the picker only ever offers choices the SQL can honour.
“Table” doesn’t mean “only a table”. The same result set becomes a top-N bar, a pie or a trend line depending on what you group it by.
Where it lives
Section titled “Where it lives”Reporting is a collapsible group in the sidebar, under Logging & Reports → Reporting, with three screens:
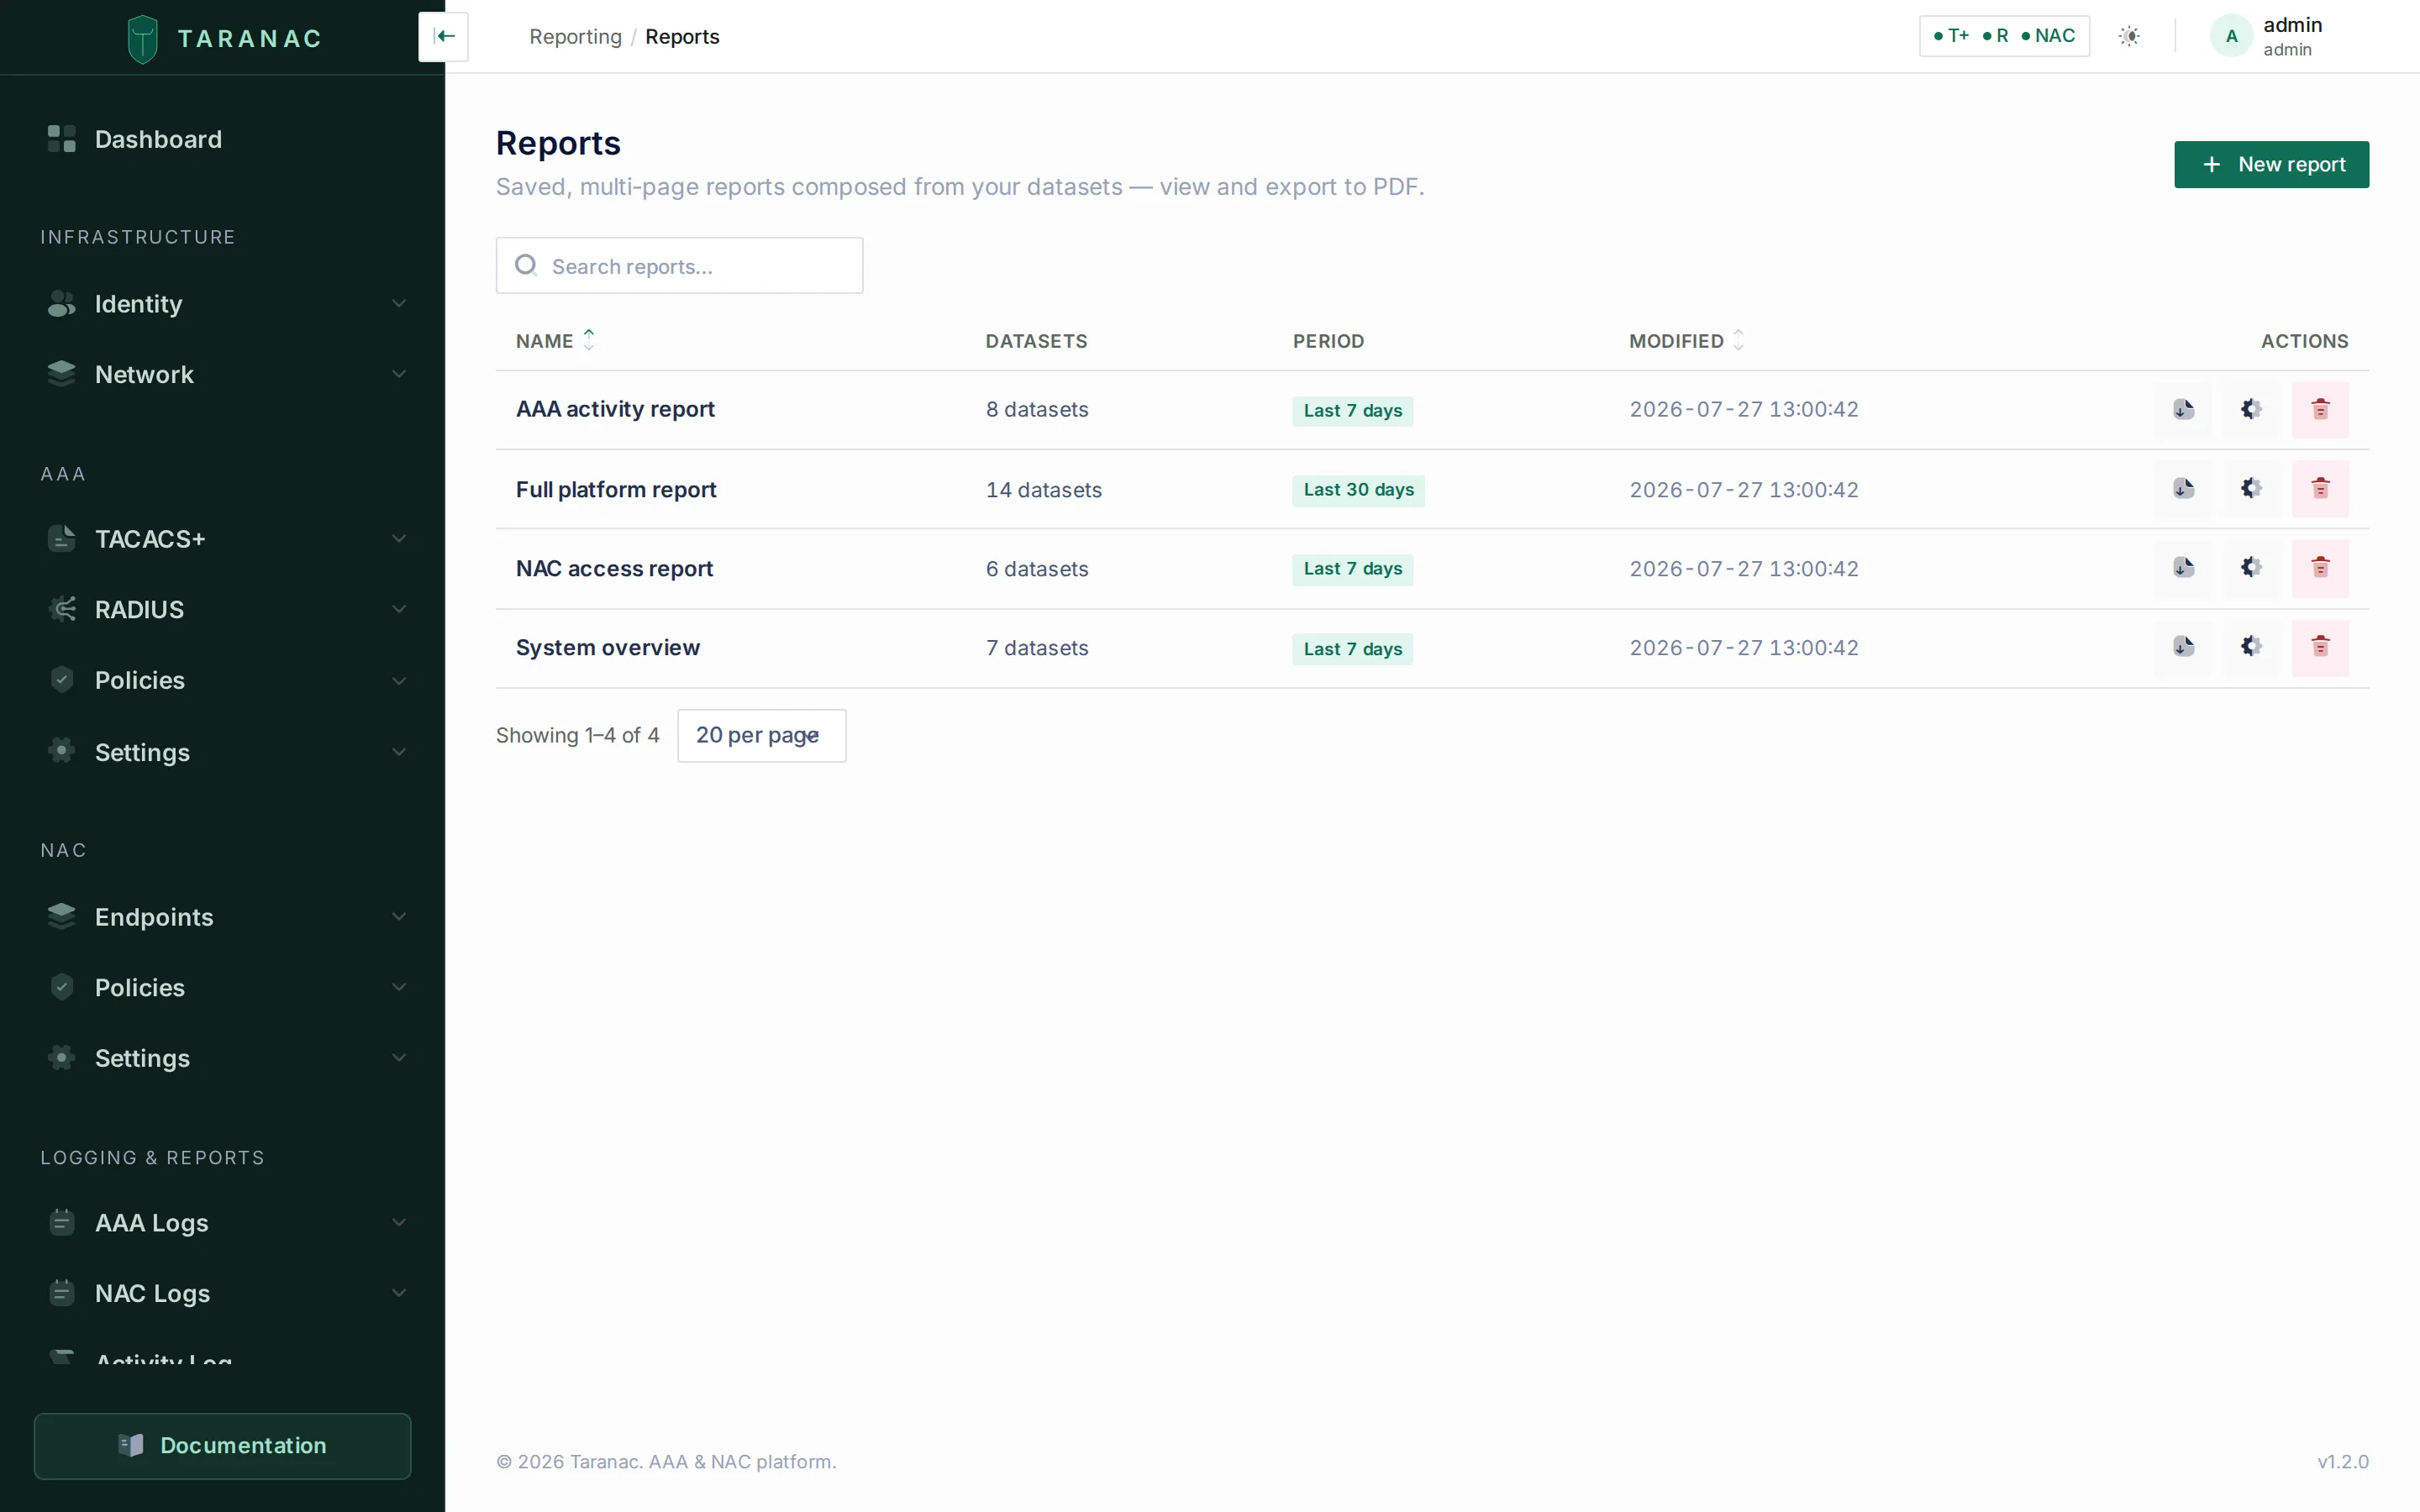 Saved reports, each showing how many datasets it is composed of and the period it covers.
- Reports — saved multi-page documents.
- Scheduler — recurring email delivery. This item
appears only for an account holding
reports.schedule; the other two need onlyreports.view. - Datasets — your saved questions, and the template catalogue you create them from.
There is a fourth way in: a Reports dashboard widget lists the five most-recently-changed reports with their period, and — for an account that may export — downloads any of them as PDF in one click.
One piece lives outside the UI. PDF is not produced by the API. It POSTs the
finished HTML — the very document the on-screen preview shows — to
taranac-renderer, a separate container that prints it with a headless browser,
which is why an export and its preview cannot drift apart. CSV and XLSX are
written by the API itself and need nothing else, so a stack whose renderer is
down or unconfigured still exports tables; only PDF fails, and it fails loudly
rather than returning a broken file. See
architecture.
What reporting is not
Section titled “What reporting is not”It is not the log export. The AAA and NAC log screens already have their own filtering and export, and they remain the right tool for “show me this one session” or “give me yesterday’s raw authentication rows”. Reporting sits a level up: prepared questions, presented for someone who was not looking over your shoulder.
The one place the two overlap is bulk. A log-screen export stops at 10,000 rows; a dataset export runs to 100,000, and when it hits that ceiling it says so instead of quietly handing back a short file — see exports.
Permissions
Section titled “Permissions”Reporting is gated by five separate permissions, so you can hand out reading without handing out editing:
| Permission | Allows |
|---|---|
reports.view | open the Reports and Datasets screens and the template catalogue |
reports.run | render them — previews, quick view, ad-hoc template runs |
reports.build | create and edit datasets and reports |
reports.export | download CSV, XLSX and PDF |
reports.schedule | see, create and manage scheduled delivery |
Two of those are worth reading closely. reports.view does not reach the
Scheduler: every schedule route, and the sidebar item itself, is gated on
reports.schedule alone, so a viewer does not merely lack the buttons — they never
see that deliveries exist. And reports.export is one of the few export
permissions in the product that is genuinely enforced; the AAA-log and audit-log
export switches are not (RBAC).
The common case is an auditor or a manager who gets reports.view and reports.run
and nothing else: they can open and read everything on screen, cannot change what is
being measured, and cannot take a copy away. That is exactly the shipped demo
role, which is granted run on top of its blanket read-only view for precisely
this reason.
A note on safety
Section titled “A note on safety”Because the queries are ours and not yours, reporting can be strict in ways an open query tool cannot be.
Your filter values are passed as bound parameters, never pasted into a query string. Every sortable and groupable column is a whitelist, cross-checked against the template’s declared result columns as the product starts — a template that advertises a control its SQL cannot honour refuses to load rather than misbehaving in production.
Reporting also does not run on the connection the rest of the product writes through. It has its own database engine, opened read-only at the Postgres level and capped by a 30-second statement timeout, on a DSN you can point at a read replica without changing anything else. A runaway report is a slow report, not an outage.
And a code-reviewed registry of secret columns — private keys, certificate signing requests, session tokens, verification hashes, just-in-time credential plaintext — is checked in CI against the declared output columns of every template, so a template that starts projecting one fails the build. The guard is deliberately a review aid rather than a runtime cage: it matches column names, so it catches the accidents that actually happen (selecting a secret, or a schema rename turning an innocuous output into one) and leaves a deliberately aliased secret to code review. Since templates ship in the release and you cannot author one, that review is the gate every query passes through.
Related
Section titled “Related”- Datasets — building and configuring them
- Reports — composing multi-page documents
- Exports — PDF, CSV and XLSX
- Scheduled delivery — recurring email
- Template catalogue — all 43, by area