

Exports
Reporting exports to PDF, CSV and XLSX. Which of those you get depends on what you are exporting, and the rule is simple enough to state in one line:
A preset exports to PDF. A table exports to PDF, CSV or XLSX. A report exports to PDF.
Why presets are PDF-only
Section titled “Why presets are PDF-only”A preset is a composed page — KPI tiles, donuts, trends, rosters, laid out deliberately. Flattening that into a spreadsheet does not produce “the same data in another format”; it produces a pile of unrelated result sets with the arrangement thrown away, which is precisely what made the preset worth having.
A table is the opposite: one tidy result, which is exactly the thing a spreadsheet is for. So tables get all three formats.
The rule is not just dialog dressing. The server derives the allowed formats from the template’s kind and rejects anything else, so a format the dialog greys out is also a refused request.
If you want a preset’s numbers in a spreadsheet, find the table template covering the same ground — most areas have both. The catalogue marks the kind of every template.
Exporting a dataset
Section titled “Exporting a dataset”Export on a dataset row — Logging & Reports → Reporting → Datasets — opens the dialog.
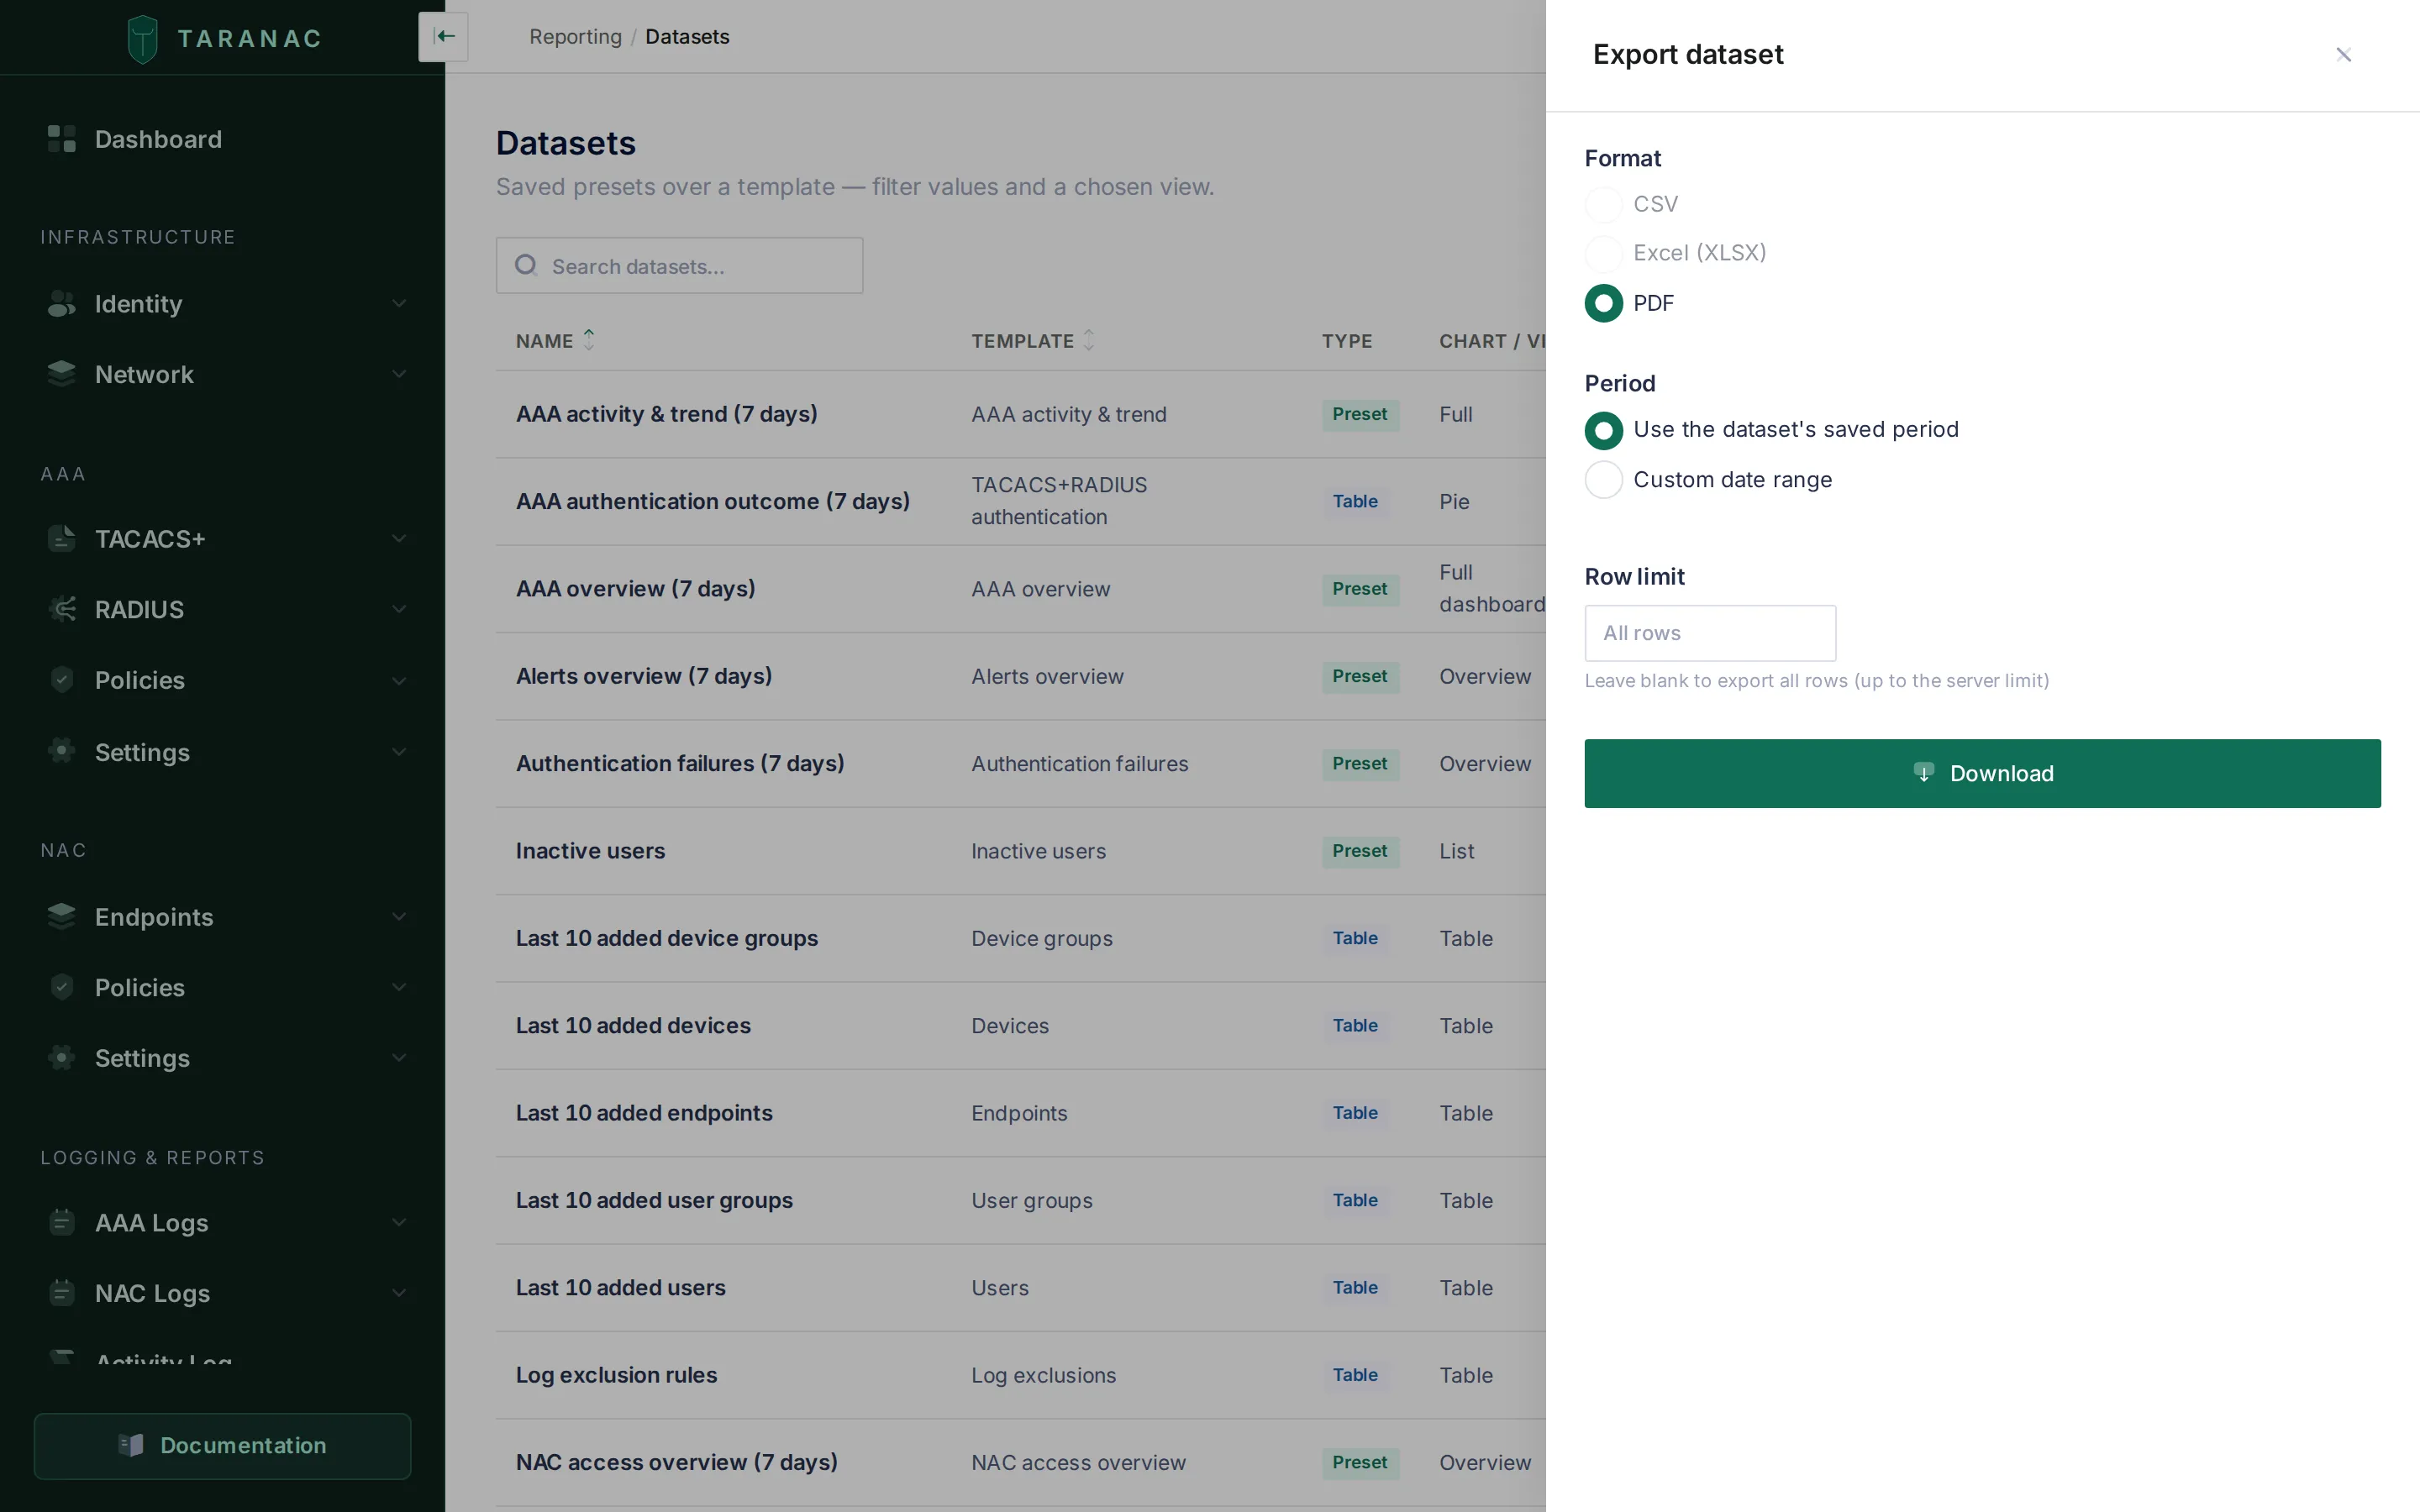 Format, period and row limit — the three things a single export may override.
Format offers only what the dataset’s kind supports. The rest are still listed, but disabled, so a preset says plainly that PDF is all it has rather than leaving you to wonder where CSV went.
Period defaults to the dataset’s saved period, so an export matches what you saw on screen. Choosing custom date range overrides it with fixed dates for this one export — it does not change the dataset. The two ends are independent and either may be left empty: an empty start means since the beginning, an empty end means up to now, and leaving both empty exports all time, which is now an explicit choice rather than a silent default. The dates you pick are wall-clock in the system timezone — the zone the screen is already showing — so the window cannot quietly slide by your offset.
Row limit is blank by default, and blank means every row up to the server’s
ceiling: 100,000 rows (reports_max_export_rows). Type a number to take fewer;
whatever you type is clamped to between 1 and that ceiling. It is deliberately not the
dataset’s on-screen limit — a preview is squeezed onto a page, an export is meant to
carry volume. A PDF export ignores the field entirely: a PDF is a rendered document,
and it renders the dataset exactly as saved, its own limit included.
A spreadsheet is the rows under the chart
Section titled “A spreadsheet is the rows under the chart”A CSV or XLSX export of a table dataset is always the tidy single-query result — whatever view the dataset is saved as. A dataset saved as a bar, pie or line chart still exports the rows underneath the chart, never the aggregated two-dimensional result you are looking at.
It is worth being blunt about this, because it surprises people. Export a “top 12 by failures” bar chart to CSV and you do not get twelve summed rows; you get the several thousand raw log records the chart was computed from. The aggregation belongs to the view, not to the data, and a flat file is the data.
So if what you want is the ranked twelve rows in a spreadsheet, build it as a table rather than a chart — the table view has sort and row limit for exactly that, and Datasets shows the shape. If what you want is the chart itself, export that dataset as PDF: the PDF path is the opposite of the flat one, and renders the view.
What lands in the file
Section titled “What lands in the file”A spreadsheet is data, not a printout, so the values in it are deliberately not the
ones on screen. The HTML did the human rounding; the file must not. A percentage is the
raw 0..1 ratio rather than 45.0%, a duration is whole seconds rather than
1h 02m, a size is bytes rather than 1.5 GB, numbers carry no thousands separators,
and an empty value is an empty cell rather than a dash. XLSX keeps native types — real
numbers and real dates, so Excel sorts them properly — with a display format alongside;
CSV writes timestamps as ISO-8601 with a numeric offset, so they parse back cleanly.
Either way, timestamps are in the system timezone. Column headings are the same
translated labels as on screen, and in XLSX the header row is frozen and filled with
the reporting accent green, so the file and the screen match at a glance.
Text cells get one extra piece of handling worth knowing about. A raw table can carry
text somebody else chose — the username of a failed login, a device name, a user
agent — and a spreadsheet executes any cell whose text starts with =, +, - or
@ as a formula. Every text cell beginning with one of those, or with a control
character, is written with a leading apostrophe, so it opens as inert text in Excel and
LibreOffice instead of running. A small oddity in the cell; a real hole closed.
Exports are also ordered, always. Even for a template that declares no sort of its own,
an export emits a deterministic ORDER BY over the columns it is writing. An unordered
LIMIT over millions of log rows would hand back an arbitrary slice, and the same
export run twice would not produce the same file.
Truncation is never silent
Section titled “Truncation is never silent”The exporter asks the database for one row more than the limit, so it knows whether
there was more rather than guessing at the boundary. Every export response carries the
row count it wrote in X-Taranac-Export-Rows, and one that hit the ceiling adds
X-Taranac-Export-Truncated: true. In the dialog that becomes a banner naming how many
rows were written and saying the limit was reached — and unlike the success toast, the
dialog stays open holding it, so you cannot miss it and walk off with a partial file.
That matters for evidence. A CSV that stops at ten thousand rows with no indication looks exactly like a CSV of ten thousand rows, and the difference can be the whole finding. If you see the truncation notice, narrow the period or raise the limit and export again.
PDFs are never truncated. The ceiling is a CSV/XLSX rule; a PDF is a rendered document that runs as long as it runs. (For contrast, the log exports elsewhere in the product — AAA, NAC, audit — cap at 10,000 rows.)
A window too wide to scan at all fails differently: the query is cancelled by the reporting statement timeout, and you get “the selected period is too large to export — narrow the range and try again” rather than a generic error.
Exporting a report
Section titled “Exporting a report”Download PDF, from the report list or from the builder.
Export always takes the last saved version. While you are creating a report the button is disabled, saying “Save the report first to export it”; on a report that already exists it is enabled, and it renders what is stored — not the edits currently on screen. Save first, then export.
The preview and the PDF come from the same server-side render, so they cannot drift apart in content: the preview is not a browser’s approximation of the document. They are not the same file, though, and the differences are deliberate. The preview’s contents list is static text — a continuous scroll has no pages to number — while the PDF’s entries are clickable, with a dotted leader and the page each section actually landed on; and the cover is printed separately as a full-bleed, unnumbered front page and merged ahead of the numbered body. What you see is what will be in the file; the file is paginated.
When the PDF renderer is unavailable
Section titled “When the PDF renderer is unavailable”Every PDF — a dataset’s and a report’s alike — is printed by the taranac-renderer
container, which makes PDF the one export with a moving part behind it. Three outcomes
are worth telling apart:
- Not configured on this server. No renderer credentials are wired: “PDF export is not configured on this server” (HTTP 503).
- Busy. The renderer is up but its queue is full: “temporarily unavailable — try again shortly” (503). Ask again in a moment.
- Unreachable, timed out, or it failed to produce a document. A downstream failure (502); the message says which of the three.
An export you asked for by hand is not retried — you are sitting in front of it, and a silent second attempt would only make you wait longer for the same answer. Scheduled delivery is the path that retries, twice, one and two seconds apart, and only for a busy renderer.
CSV and XLSX never touch the renderer at all.
Filenames and non-Latin names
Section titled “Filenames and non-Latin names”An export arrives as a download named <dataset or report name>_<YYYYMMDD-HHMMSS>
plus the extension, timestamped in the system timezone. The Content-Disposition
header carries the name twice, per RFC 6266: a stripped ASCII version as the safe
fallback, and a UTF-8 version so that a dataset named in Cyrillic or another non-Latin
script survives the trip intact rather than arriving as a row of question marks.
Permissions
Section titled “Permissions”Exporting needs reports.export. It is separate from reports.view and
reports.run on purpose: you can let someone read reporting on screen without
letting them carry the data out of the product. Without it the export controls are not
drawn at all — no Export on a dataset row, no Download PDF on a report — rather
than failing when pressed. (A dataset whose template a release removed shows no Export
action either; there is nothing left to run.)
Every export is audited, because it is a security-relevant read: AAA and NAC data
leaves the system. A dataset export records DATASET_EXPORTED with the format, the row
count, the truncation flag, the limit and the window used; a report export records
REPORT_EXPORTED.
One thing to know when planning roles: reports.export is one of only two export
permissions in the product that is genuinely enforced — the other guards the NAC
authentication-log export. The AAA-log and audit-log screens declare an export
permission too, but their export endpoints check the matching view permission, so
anyone who can read those logs can also download them.
Related
Section titled “Related”- Datasets — where the saved period comes from
- Reports — composing the document a PDF is made of
- Scheduled delivery — the same files, mailed automatically