

Datasets
A dataset is the unit you actually work with. It pins a template to a period and a presentation, gives that combination a name, and keeps it. Everything else in reporting is built on datasets: a report is a stack of them, and a schedule delivers them.
A dataset is also the only part of reporting that lives in the database. Templates are constants in the product, versioned with the release; a dataset is one template plus your filter values plus your display configuration, stored under a name of your choosing. One template backs any number of them. The template TACACS+ authentication can sit behind “TACACS+ authentication — last 24 hours”, “TACACS+ failures by device, last 30 days” and “TACACS+ command activity, top 20” at the same time, each saved separately.
Creating one
Section titled “Creating one”Logging & Reports → Reporting → Datasets → New dataset opens the catalogue. Templates are grouped by area — System · AAA · NAC · Configuration Tracker · Alerts, presets ahead of tables inside each — with a search box over titles and descriptions. Each card says what question the template answers, carries a Preset or Table badge, and offers a Preview of the template’s passport before you commit to it.
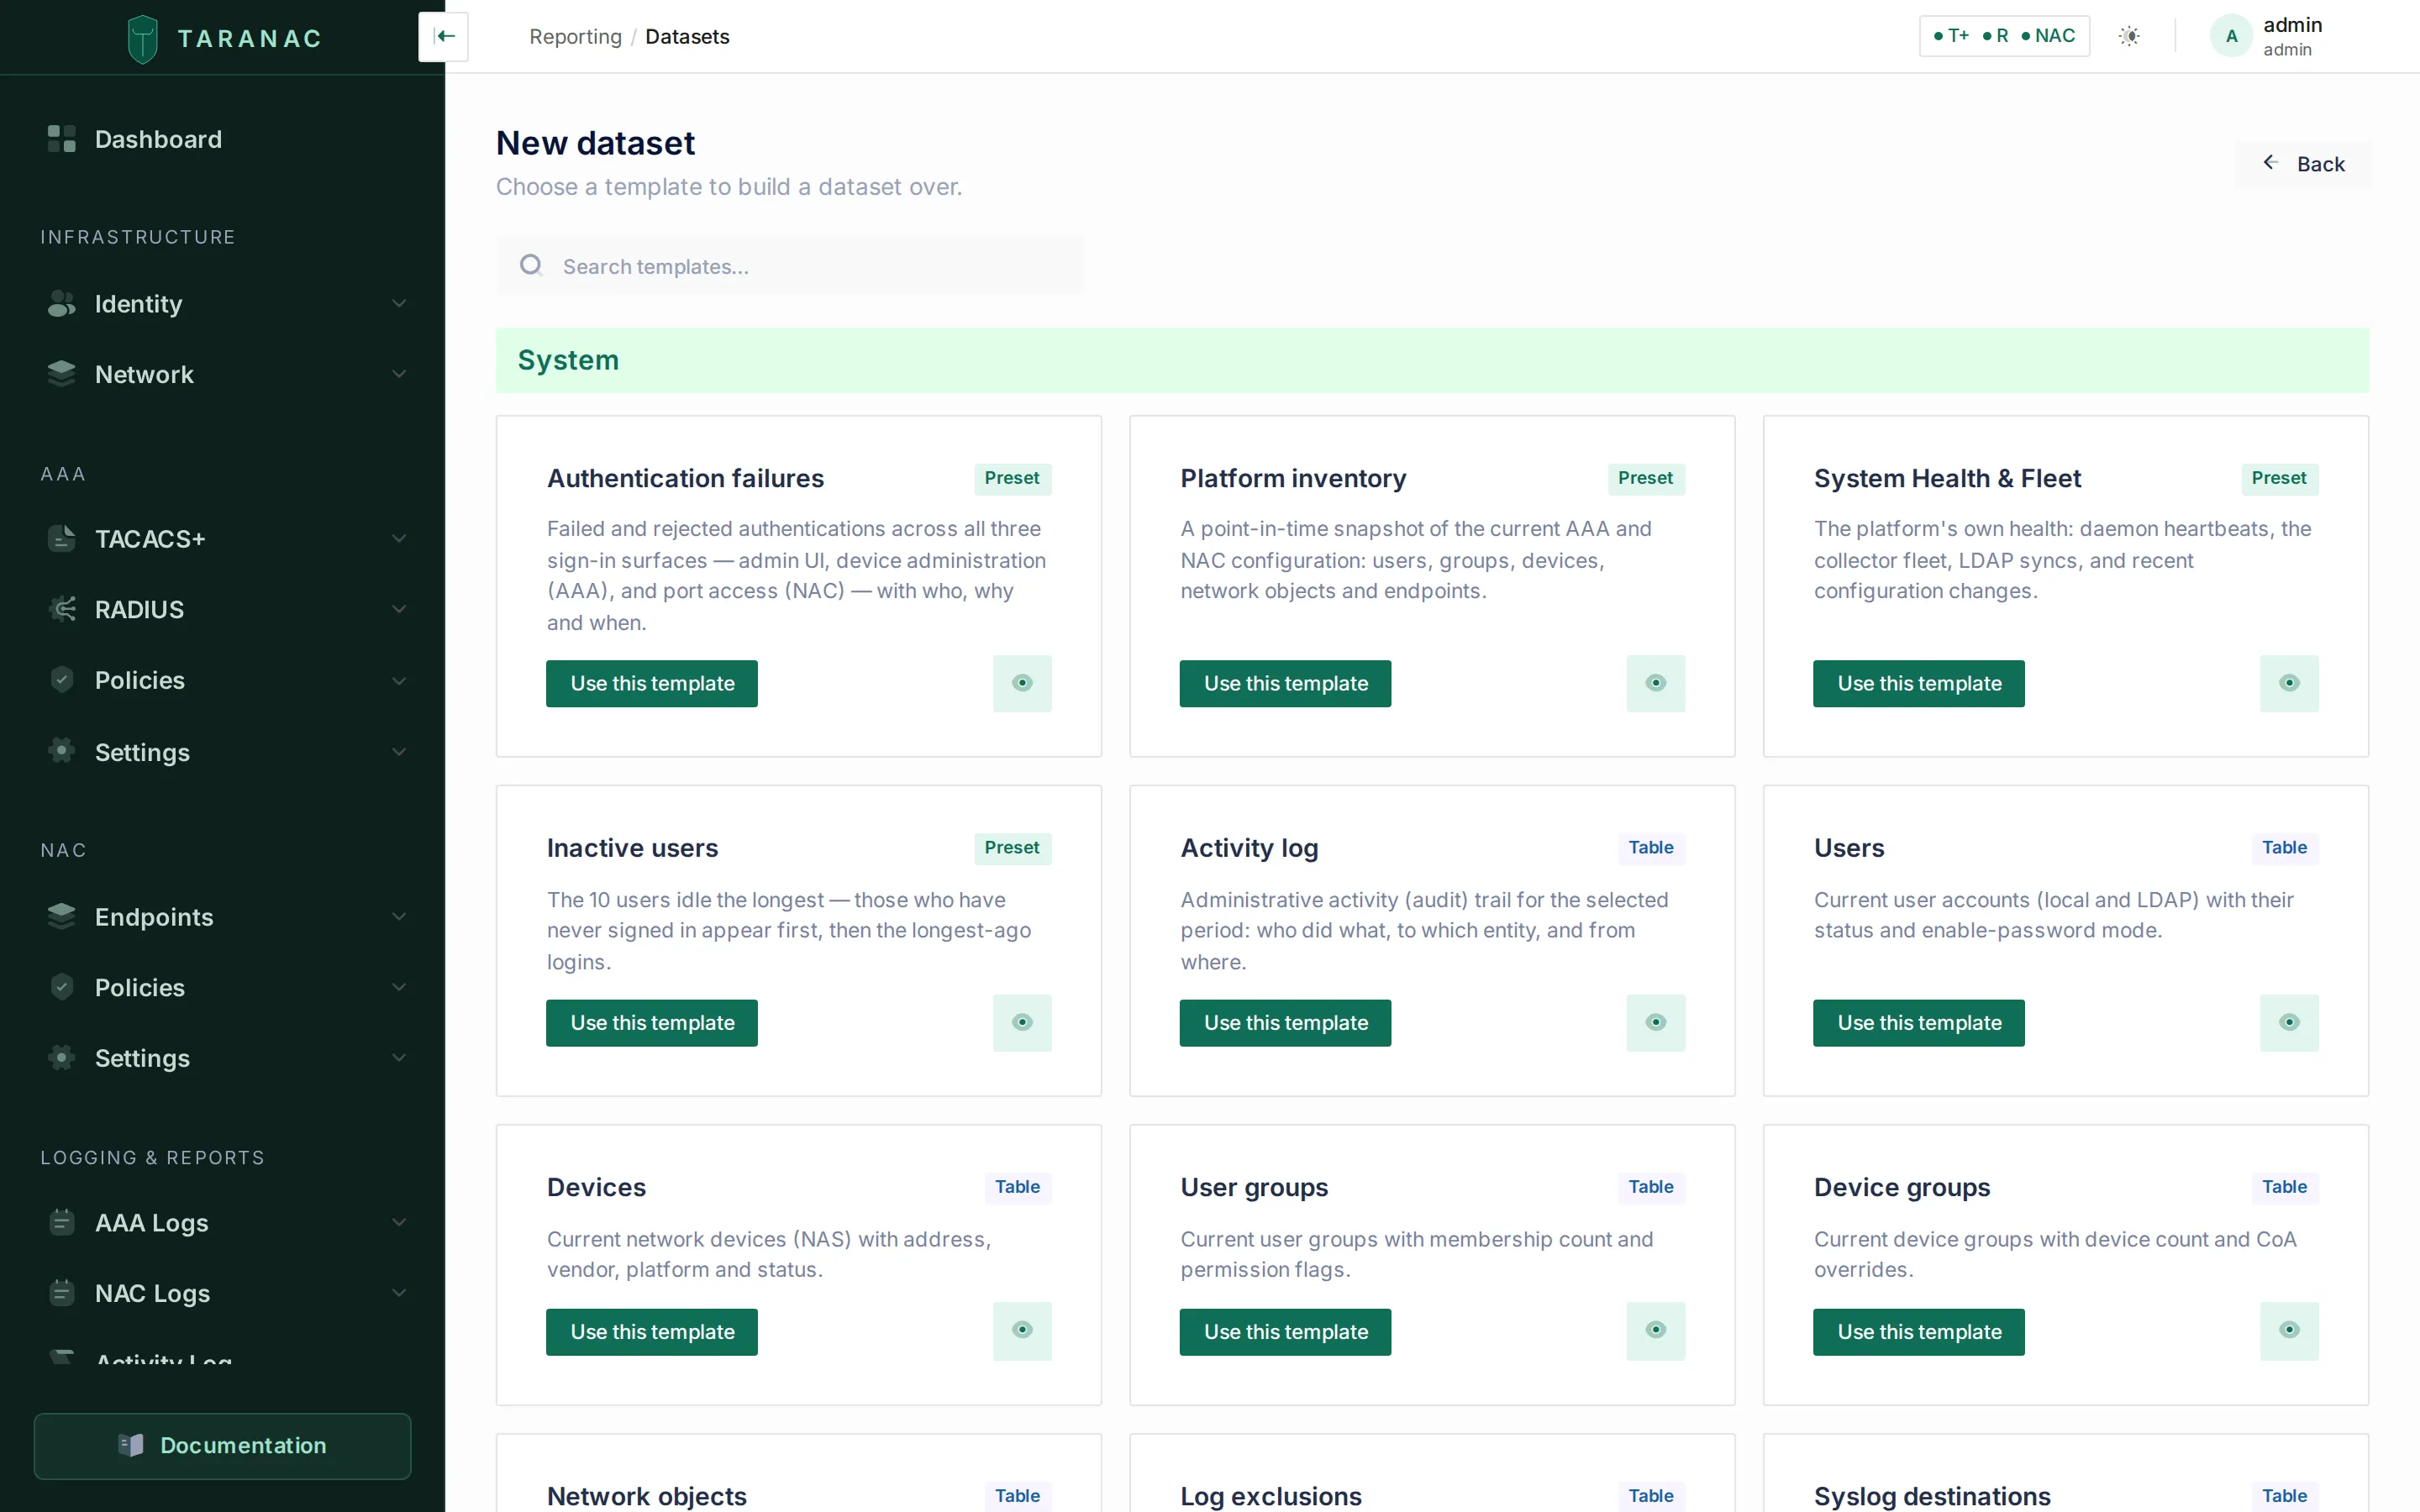 Choosing a template. The description tells you what the template answers; the badge tells you which kind it is.
Pick one, and you land in the builder with a live preview on the right.
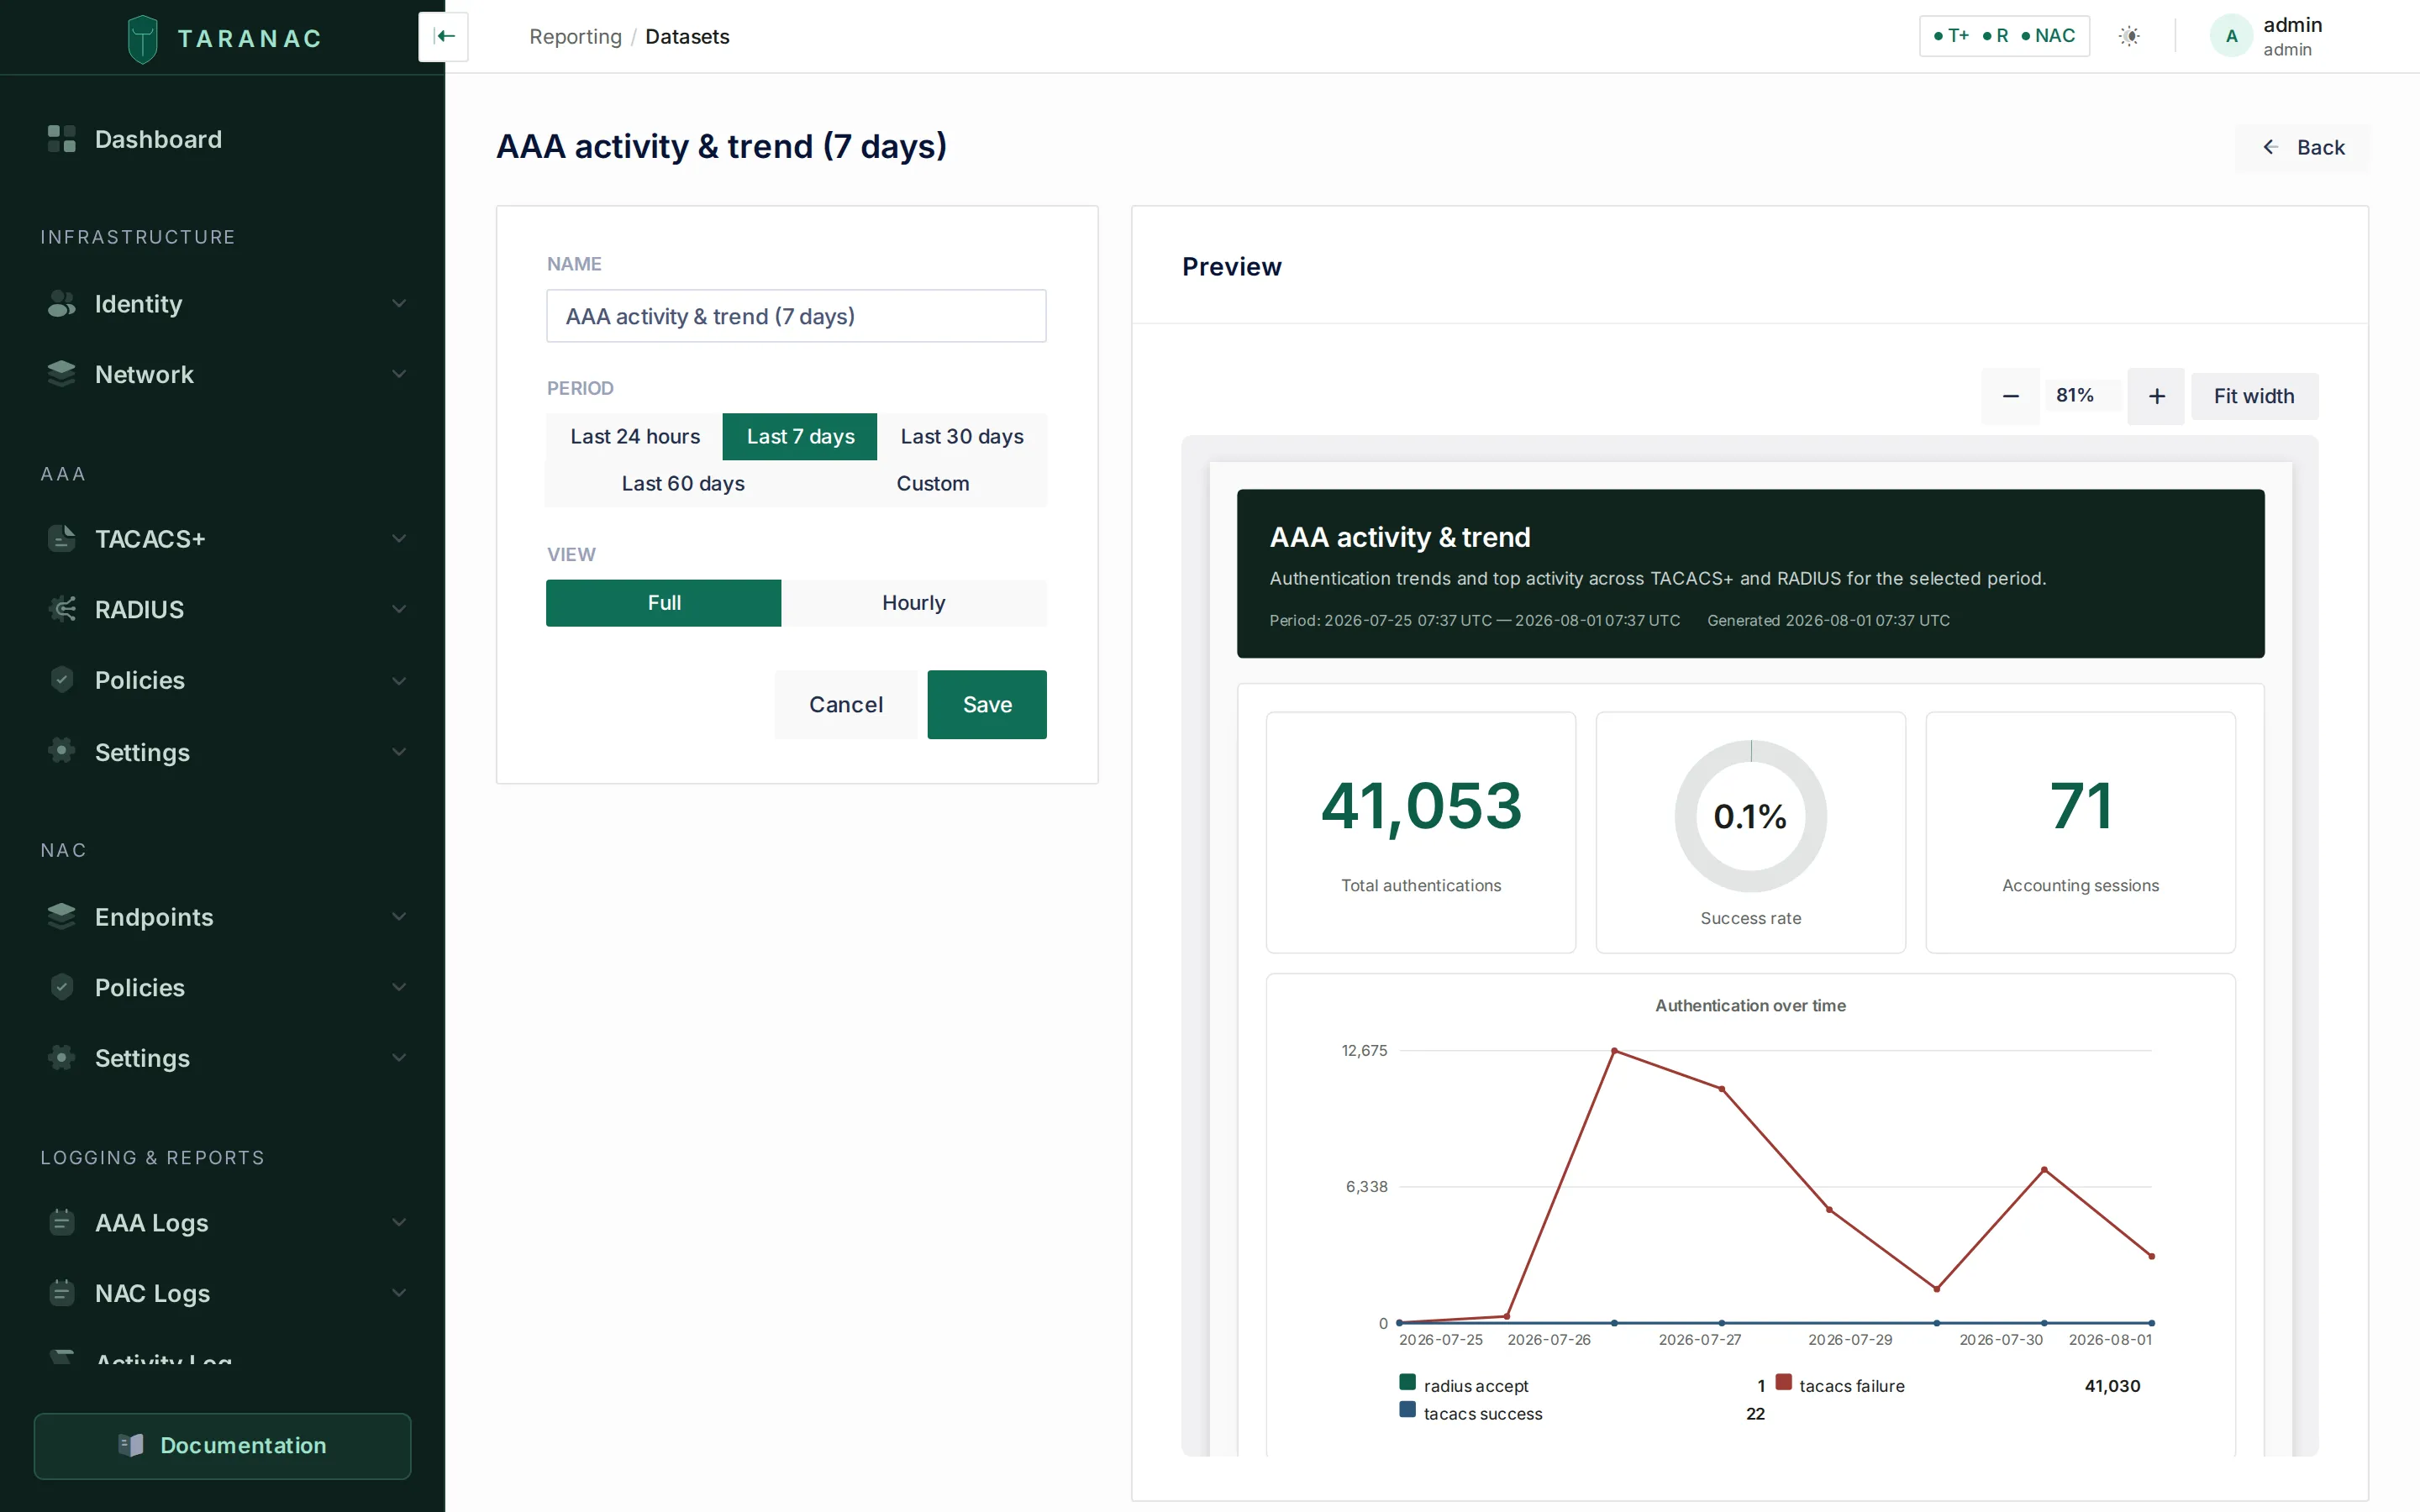 The builder: configuration on the left, a rendered preview on the right. The preview marks itself out of date when you change something, and refreshes on demand.
What you can configure
Section titled “What you can configure”The builder is capability-driven: it renders only the sections the template actually declares, so two templates rarely give you the same form. Whatever it shows you, the server validates again on save — and again on every run — against the same rules.
Every dataset has a name — unique across the installation, up to 128 characters — and, if its template takes one, a period.
The period is always relative. Every template that takes one offers last 24 hours, last 7 days and last 30 days; most add last 60 days, and all but one add a Custom window of N days, capped at 365. Last 7 days is pre-selected everywhere.
A dataset never stores absolute dates. That is deliberate, and it is what makes a saved dataset still mean something a month later: a dataset called “last 7 days” still means the last seven days in six months’ time, whether you open it by hand or a schedule mails it to you. The window is resolved to real timestamps at the moment of each run, not at the moment you saved it. (A one-off export can override the window with fixed dates — see Exports — but that does not change what the dataset holds.)
Some templates are point-in-time and have no period at all: an inventory of your devices, or the current certificate posture, is a snapshot of how things are now. The catalogue marks which is which.
For a preset
Section titled “For a preset”A preset owns its own layout, so there is exactly one more choice: the view. A template that offers several gives you meaningfully different cuts of the same data — a full dashboard versus a bare totals row, an overview versus a rejects breakdown, a daily trend versus an hourly one.
For a table
Section titled “For a table”A table hands you the presentation.
Chart. There are exactly four forms: table, bar, pie and line — and the last three only on the nine period-taking tables, which are precisely the ones that declare something to group by. The other eighteen are inventories with nothing to aggregate over a window, and offer the table alone. (Donut and stat do appear in Taranac reports, but only inside a preset’s authored layout — they are never a choice you make.)
The chosen chart scopes the rest of the form. Switch to a chart and the columns/sort/limit block is replaced by Aggregation; switch back to Table and the aggregation is dropped and your columns, sort and limit return.
Aggregation — offered for bar, pie and line, and shaped by which one:
- Bar and pie — Group by one of the columns the template allows, a Function, and — for any function other than count — a Measure.
- Line — a Granularity (hourly, daily, weekly or monthly) over the single time column the template nominates, plus an optional Split by. Left at None (single line) you get one line; pick a column and the line splits into one line per value.
- The Function list is the template’s own, not a fixed menu. In the shipped catalogue only RADIUS accounting offers sum, average, minimum and maximum — it is the one log table with numeric measures worth summing. Everywhere else Count is the only function, and count takes no measure.
There is no “top N” control on a chart, and none is needed. A bar or pie keeps the 12 largest groups and folds the entire tail into a single Other slice. The fold is computed in SQL, so a column with ten thousand distinct values comes back as thirteen rows, not ten thousand. A line is capped at 366 points — and when your window would blow past that, the server coarsens the granularity instead of truncating the series: ask for hourly over 60 days and you get a complete daily line, not the first fortnight by hour. A split line ranks and folds its series the same way, with an Other series.
Columns, sort and row limit belong to the table view, and disappear on a chart:
- Columns — a checkbox per declared column. The selection starts at the template’s default: every column it does not mark hidden. Hidden by default is a property of the template, and it is a curation knob about what fits on a page rather than a restriction — tick a hidden column and it shows. You cannot clear the last one.
- Sort — a column from the template’s whitelist, plus a direction. Some templates fix the direction; then only the column is offered.
- Row limit — pre-filled with the template’s default and capped at its maximum.
The builder only offers mappings the template supports, because each column is declared as either a dimension (something to group or plot along an axis) or a measure (something to count or sum). That is why you cannot accidentally build a chart that averages a hostname.
One upgrade note, for hand-built datasets only. Before 1.2.2, the RBAC roles table declared an is_system column. No role was ever a system role, so the column was constant-false noise and 1.2.2 removed it. A dataset that had been built by hand on that template with is_system among its shown columns is now refused with “One or more selected columns are not valid for this template” — on save and on run alike, because the same check guards both. The fix is to open it, re-tick its columns, and save. No dataset that ships with Taranac uses that template, so nothing seeded is affected; this only reaches a dataset someone built themselves.
Previewing
Section titled “Previewing”The preview is rendered by the server, not drawn in your browser — the same rendering path that produces the PDF. What you see in the panel is what lands in the file.
It queries the database only when you ask it to. Any edit marks the panel out of
date — the last render stays on screen, blurred, under a Refresh button — so a
heavy query fires on intent rather than on every keystroke. Previewing needs
reports.run; without it the panel says so and the rest of the builder still works.
Quick view on the dataset list opens the same rendered result without entering the builder, which is the fastest way to read a dataset you are not editing.
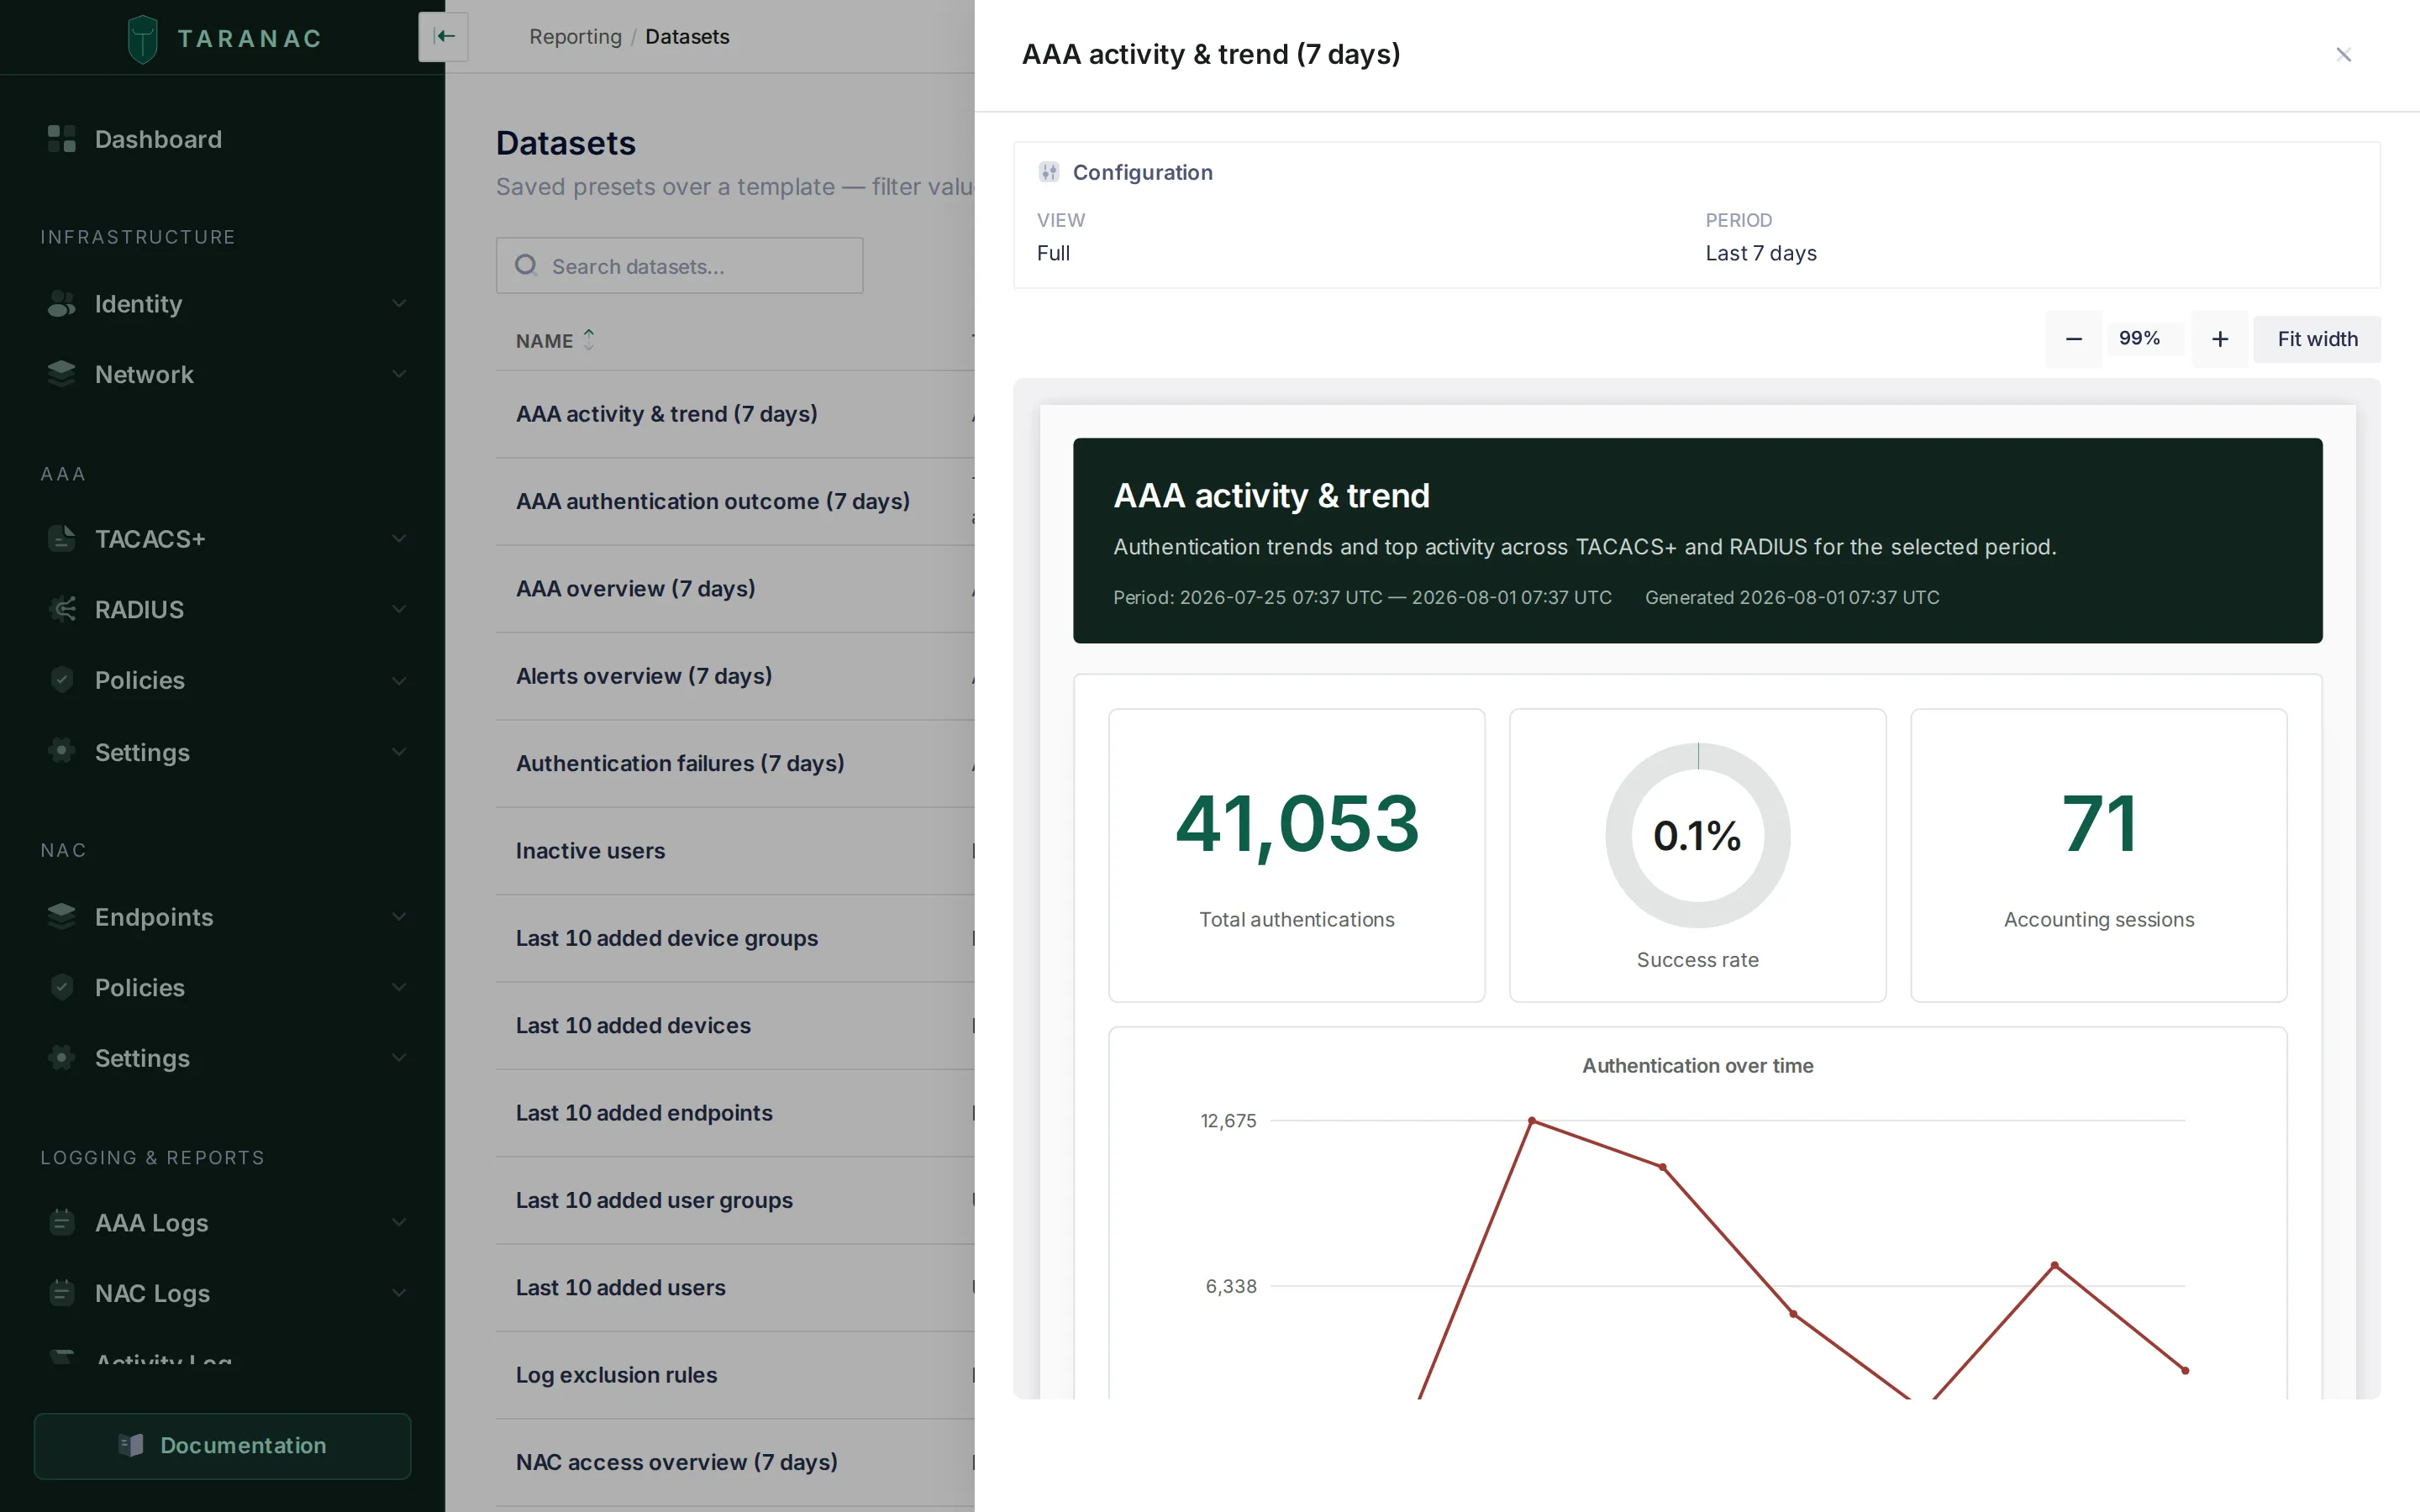 Quick view: the rendered document plus a configuration passport — the view and period for a preset, or the columns, sort, row limit and period of a table — so a screenshot of it is self-explanatory.
Managing datasets
Section titled “Managing datasets”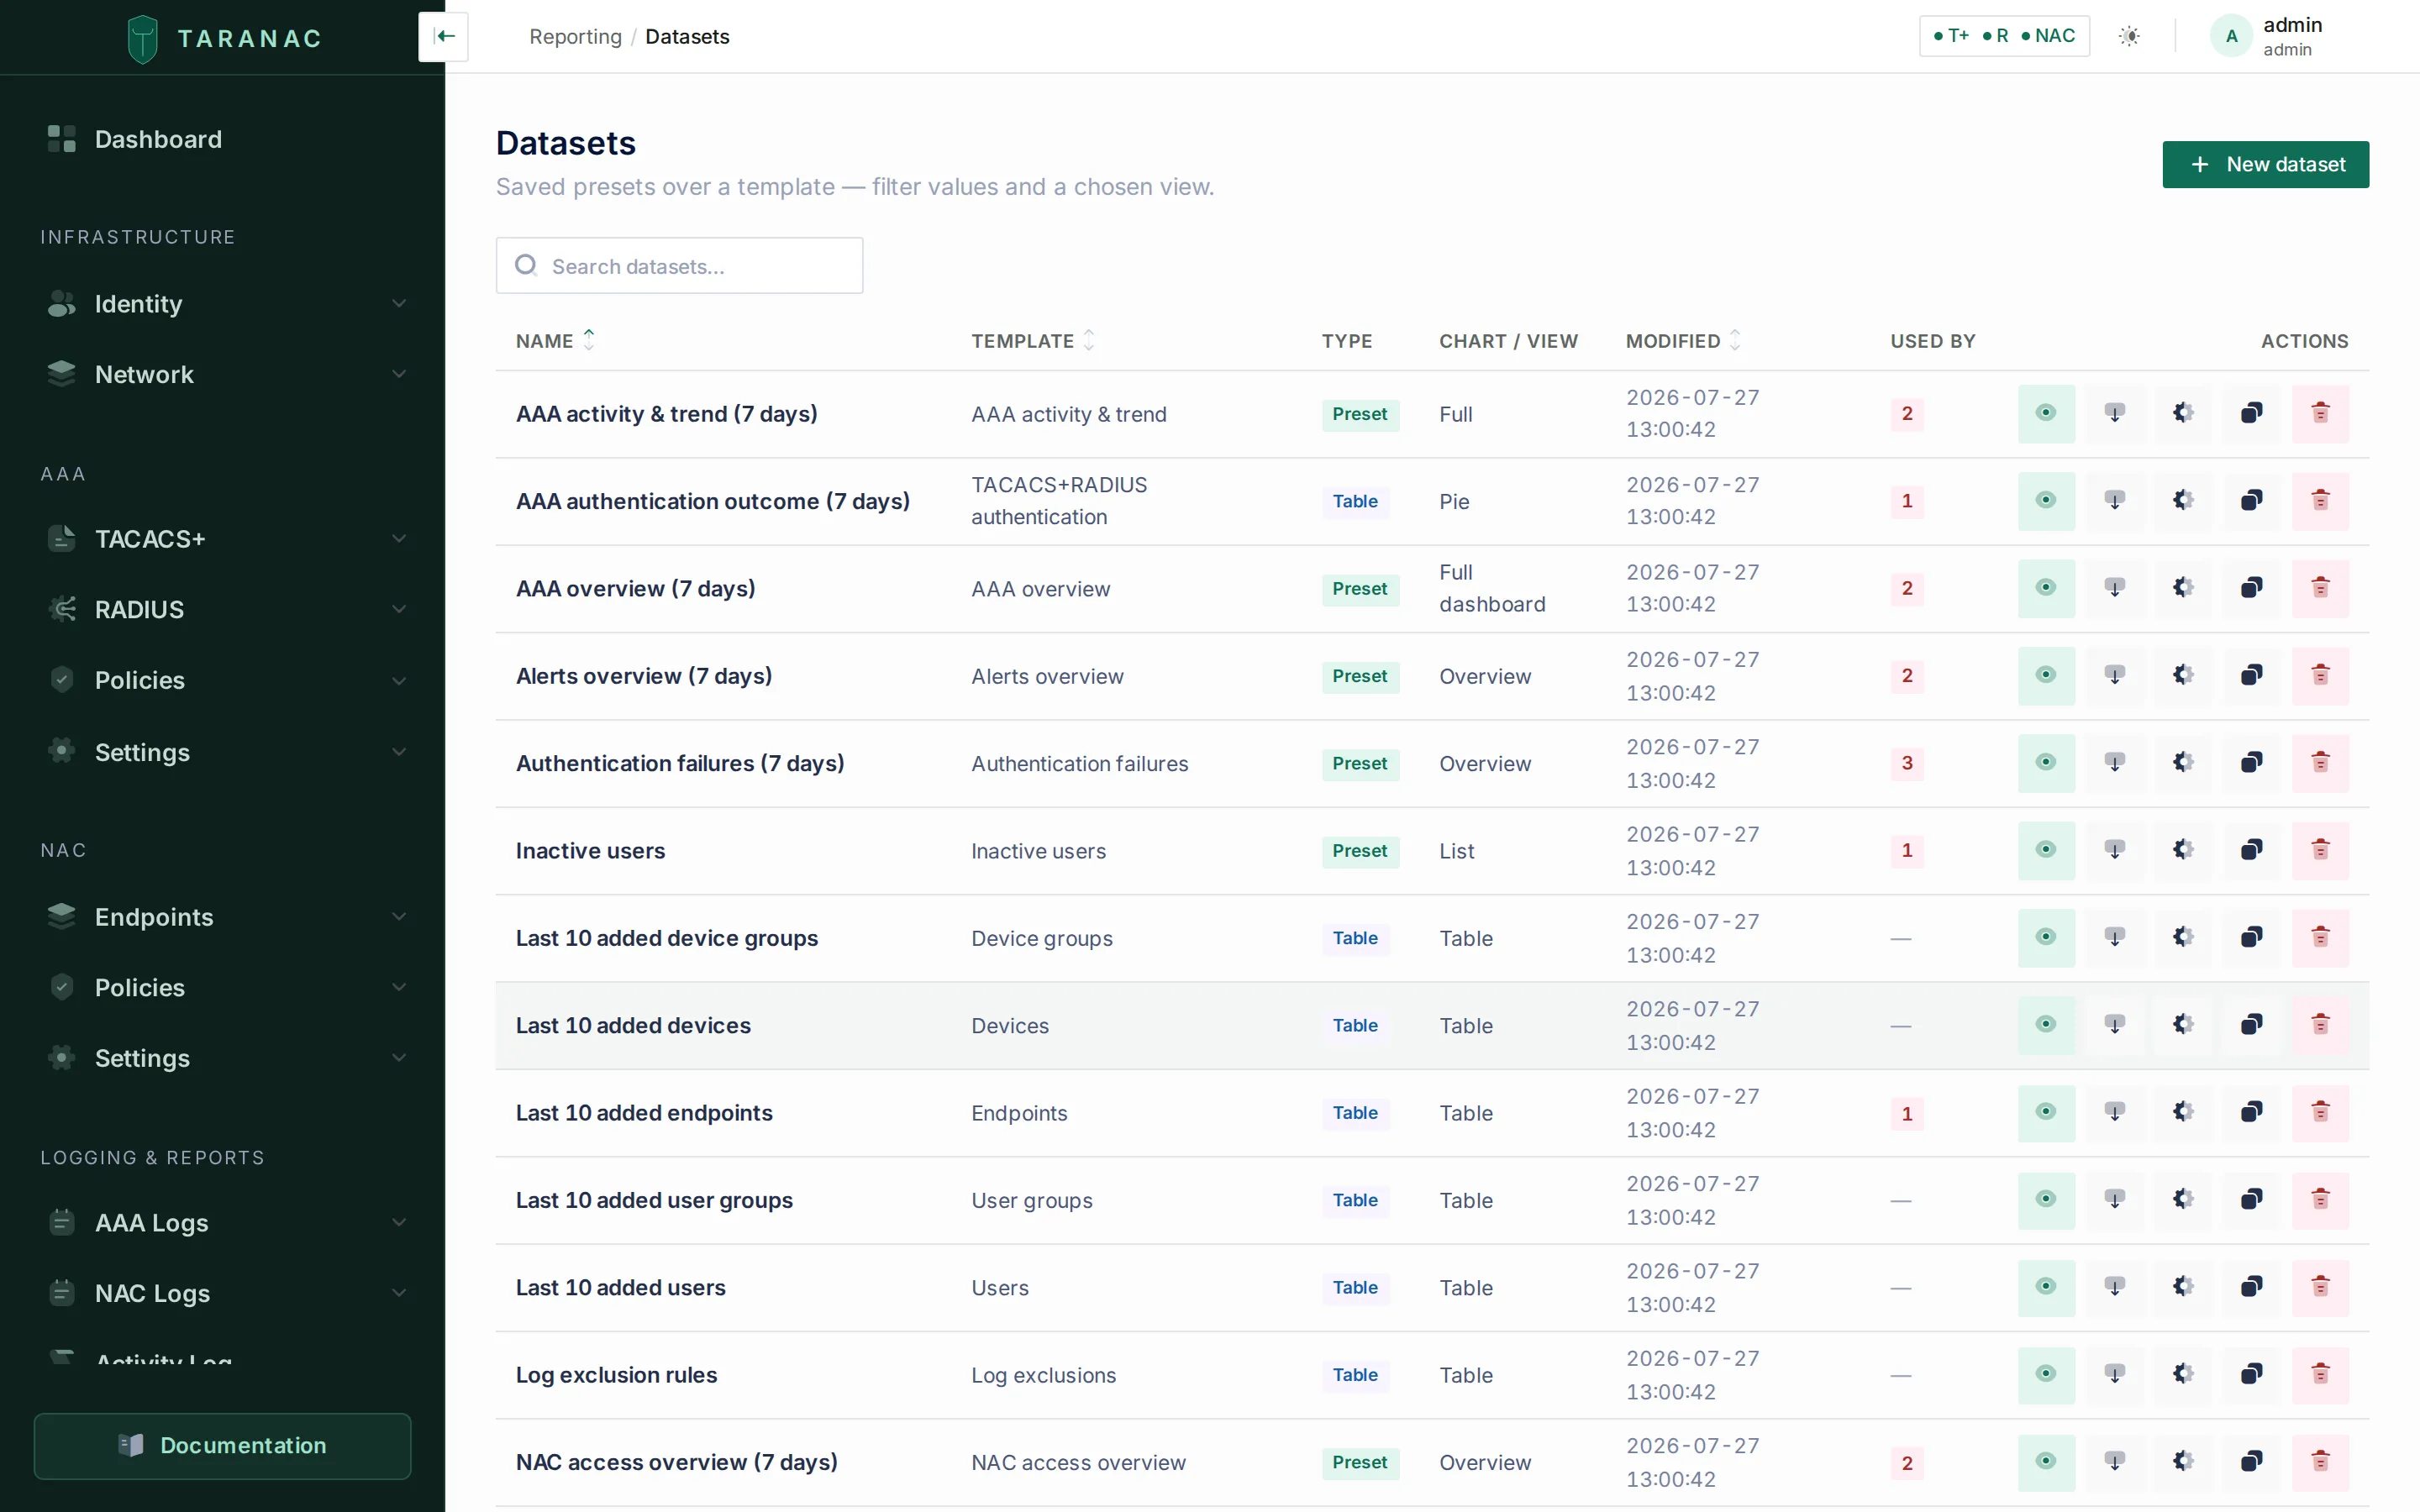 Each row shows its template, kind, presentation and when it was last modified — plus which reports use it.
Taranac ships with 33 datasets already built — 18 over presets, 7 drawn as a bar, a pie or a line, and 8 tables — so the list is useful on first boot instead of empty. They are seeded once, on first installation, behind a watermark: rename, edit or delete one and the change sticks. Nothing resurrects on the next restart.
Row actions are Quick view, Export, Configure, Duplicate and Delete.
Duplicate is the natural way to make a variant: copy “last 7 days” into “last 30 days” rather than rebuilding it. It opens the builder on a copy, named (copy), that becomes a dataset only when you save.
Who can do what. The list needs reports.view. Quick view and the builder’s
preview additionally need reports.run; Export needs reports.export; New
dataset, Duplicate and Delete need reports.build. An account with
reports.view alone still opens a dataset — read-only, inputs disabled, no Save
button. The shipped demo role is the deliberate example of that shape: full
visibility across the product plus reports.run, so it can read and render
everything and change nothing.
Delete is guarded. If a report uses the dataset, deletion is refused and the reports holding it are named, so you are never left with a report page pointing at something that no longer exists. Remove the page from the report first, or delete the report.
If a template is removed in a future release, the datasets built on it survive — a dataset points at its template by name, with no database link to break. The row stays in the list under a Template removed badge, and the rest of your reporting keeps working. What that row can no longer do is run: no quick view, no export, and no configuration change, because there is nothing left to validate the configuration against. You can still rename it, and you can delete it.
Common scenarios
Section titled “Common scenarios”A monthly access review. Take the Authentication failures preset, set the period to 30 days, name it for the review, and add it to a report you schedule on the first of the month.
A device that has gone quiet. TACACS+ device usage and RADIUS device usage include devices with zero requests in the window, which is the half that matters — a device that stopped talking to you produces no log rows at all, so it is only visible from the inventory side.
A top-N you keep coming back to. Two different shapes, depending on what you want. For a ranked chart, build a bar over the log table and group by the column you care about — the top 12 plus Other is handled for you, with no limit to set. For a ranked list you can export, stay on the table view, sort by the column that ranks it and set the row limit; that is exactly how the shipped Top 10 endpoint groups by endpoint count is built.
Related
Section titled “Related”- Template catalogue — what each template answers
- Reports — composing datasets into a document
- Exports — getting a dataset out as a file