

Every platform that holds operational data eventually gets asked for reports, and there are two easy ways to answer. Bundle a BI tool and let people build whatever they want — powerful, and now your users have to learn a second product to find out how many logins failed last week. Or ship a fixed list of PDFs — simple, and useless the moment someone needs the same thing for one device group instead of all of them.
We spent most of this release looking for the line between those two, and the answer turned out to be a layer in the middle: datasets.
Template → dataset → report
The model has three levels, and it’s worth two minutes because everything else follows from it.
A template is the lowest level, and it lives in code, not in the database. It’s a hardcoded query plus a declaration of what you’re allowed to change about it — which period windows are offered, which columns can be sorted, what the row limit is. Templates ship with the release and get reviewed like any other code.
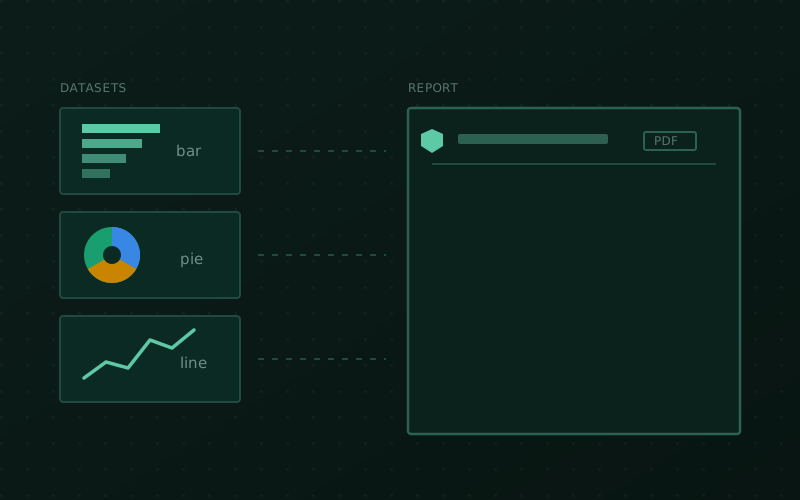
A dataset is what you save: a template plus your filter values plus your display choices. One template, many datasets — “TACACS+ authentication” is a template; “TACACS+ authentication, last 7 days, core switches, as a bar chart” is a dataset you name and keep.
A report is a multi-page composition of datasets. One dataset per page, ordered however you like. Everything that goes into a report is a dataset — there’s no second path, which is what keeps the whole thing predictable.
That middle layer is the entire trick. You never write SQL — not a line, not ever — but you’re also not stuck with whatever we imagined. The query is ours; the question is yours.
Two kinds of template, and who owns the look
Templates come in two flavours, and the difference is who controls the presentation.
Presets are the curated ones. We author the layout in code — donut rings, KPI
strips, heatmaps, multi-series trends, hand-placed and pixel-checked. You pick the
period and, where a template offers more than one, the view. AAA overview gives
you the full dashboard or a bare row of totals. NAC access gives you the outcome
overview or the reject forensics. Presets export to PDF, because we own the layout
and it’s a designed page.
Tables are the open ones. The query is still fixed, but the display is yours: show it as a table, or map its columns onto a bar, line, pie or donut chart, pick which columns are visible, sort it, filter it. The template declares each column’s role — dimension or measure — so the chart picker only ever offers you mappings that make sense. Tables export to PDF, CSV and XLSX, because a flat result is exactly what belongs in a spreadsheet.
“Table” doesn’t mean “only a table”, by the way. The same result set is a table, a top-N bar or a pie depending on which columns you point at which channel.
43 templates in the box
Sixteen presets and twenty-seven tables ship in 1.2.0, across every surface the platform already writes to:
- AAA — activity trends, policy and command insights, per-device usage for TACACS+ and RADIUS (including the devices that have gone silent, which is the interesting half), and a cross-surface failure view that puts UI, AAA and NAC login failures side by side as rates rather than raw counts.
- NAC — port-access outcomes with a day-by-hour heatmap, reject forensics, live and historical sessions, and certificate posture bucketed by time to expiry.
- NCM — collection health, change activity across tracked configs, and just-in-time credential behaviour.
- System — configuration inventory, platform health, alert overviews, and the accounts that haven’t logged in for the longest.
- Raw tables — every log surface (TACACS+ authn/authz/acct, RADIUS auth/acct, the audit trail) and every configuration table, as flat exports.
What comes out, and why the preview is honest
Reports are assembled on the server. One HTML document is generated, and that same document feeds both the on-screen preview and the PDF — they’re identical because they’re literally the same bytes. Charts are server-rendered inline SVG, so nothing depends on what your browser felt like doing. PDF rendering runs in a small dedicated service that ships alongside the rest of the stack.
The practical effect: what you see in the preview is what lands in the mailbox. No “looked fine on screen, broke in the export”.
Scheduled delivery, with live windows
Any report or dataset can be put on a schedule and mailed out periodically.
The part worth calling out: the schedule doesn’t freeze the period. A dataset scoped to “last 7 days” stays relative — every delivery resolves that window at the moment it’s generated. You set it up once and it keeps meaning the same thing in six months. Nothing about the data is stored on the schedule; it triggers exactly the same generation path as the export button.
Read-only, and a spot on the dashboard
Reports and datasets support a read-only view, so you can hand someone the numbers without handing them the ability to change what’s being measured — the common case for an auditor or a manager who just needs the monthly figure.
Saved reports also surface as a dashboard widget, so the ones you actually use are one click from the front page.
A note on safety
Since the queries are ours, we get to be strict about them. Filter values are bound parameters, never interpolated into a query string. Sortable columns are a whitelist that’s validated against the query’s actual output at import time, so drift gets caught in CI rather than in production. And there’s a registry of columns that can never be projected under any circumstances — private keys, CSRs, session tokens, verification hashes, just-in-time credential plaintext. A reporting engine that can read everything is a data-exfiltration primitive; this one can’t.
UX sharpening
- Picker drawers apply on click. Choosing members, groups, devices, endpoints or datasets in a selection drawer now takes effect immediately, instead of making you confirm with a separate “apply”. Small change, enormous difference if you do it fifty times a day.
- Password rules live on the backend. Length and complexity are enforced identically everywhere a password is set or changed — the web UI and every login path now agree, because they ask the same authority.
- “Must change password” is honoured at device login. A local account flagged to change its password is now denied TACACS+/RADIUS/NAC sign-in until it does, instead of being blocked only in the web UI. If you use that flag as a control, it’s now actually a control.
- MFA push expiry is audited. An unanswered push approval that times out now records its own event, so “nothing happened” is visible in the trail.
Fixes and quiet improvements
- One bad batch can’t wedge TACACS+ logging. A poison log batch is dropped rather than stalling the entire authentication-log writer.
- Faster config reloads on large inventories. The TACACS+/RADIUS/NAC auto-reload now skips a full regeneration when nothing config-relevant changed, and generation no longer blocks the control-plane event loop — a large cut in idle CPU if you run a lot of devices.
- Correct timezone for scheduled jobs across nodes. The system timezone is resolved without stale caching, so scheduled reports fire at the right local time on every node of a cluster.
- Backups work on a fresh install. Creating a backup on a brand-new install no longer fails with a 500 — the backups volume gets correct ownership at boot.
- Auth settings form. Nested fields and zeroed values persist correctly.
Reporting was the biggest single thing we’ve built since the Configuration Tracker, and the design took longer than the code. If the balance lands wrong for you — a preset you’d rather bend, a table you wish were curated — that’s exactly the kind of note that shapes the next one. Where the platform goes after this is on the roadmap.
Self-hosted, artifact-only, Elastic License 2.0.